Experiment with Mandelbrot Set and D language
Fractals are fascinating. They can be found everywhere in nature, practically they can be considered the nature’s beauty. The most popular fractal is Mandelbrot set (well, its graphical representation, to be exact).
Recently I watched a video by Mathologer and got curious about how to draw and color Mandelbrot set in different ways, and also get some D programming language practice while I’m at it. Of course, it’s not the most difficult task by itself, but it was still interesting to investigate the topic and make some small tools along the way.
While investigating, I faced some interesting questions that weren’t really mentioned all in one place, so I decided to make a “report” about what I did, while also combining all the stuff I learned during the experiment in one place.

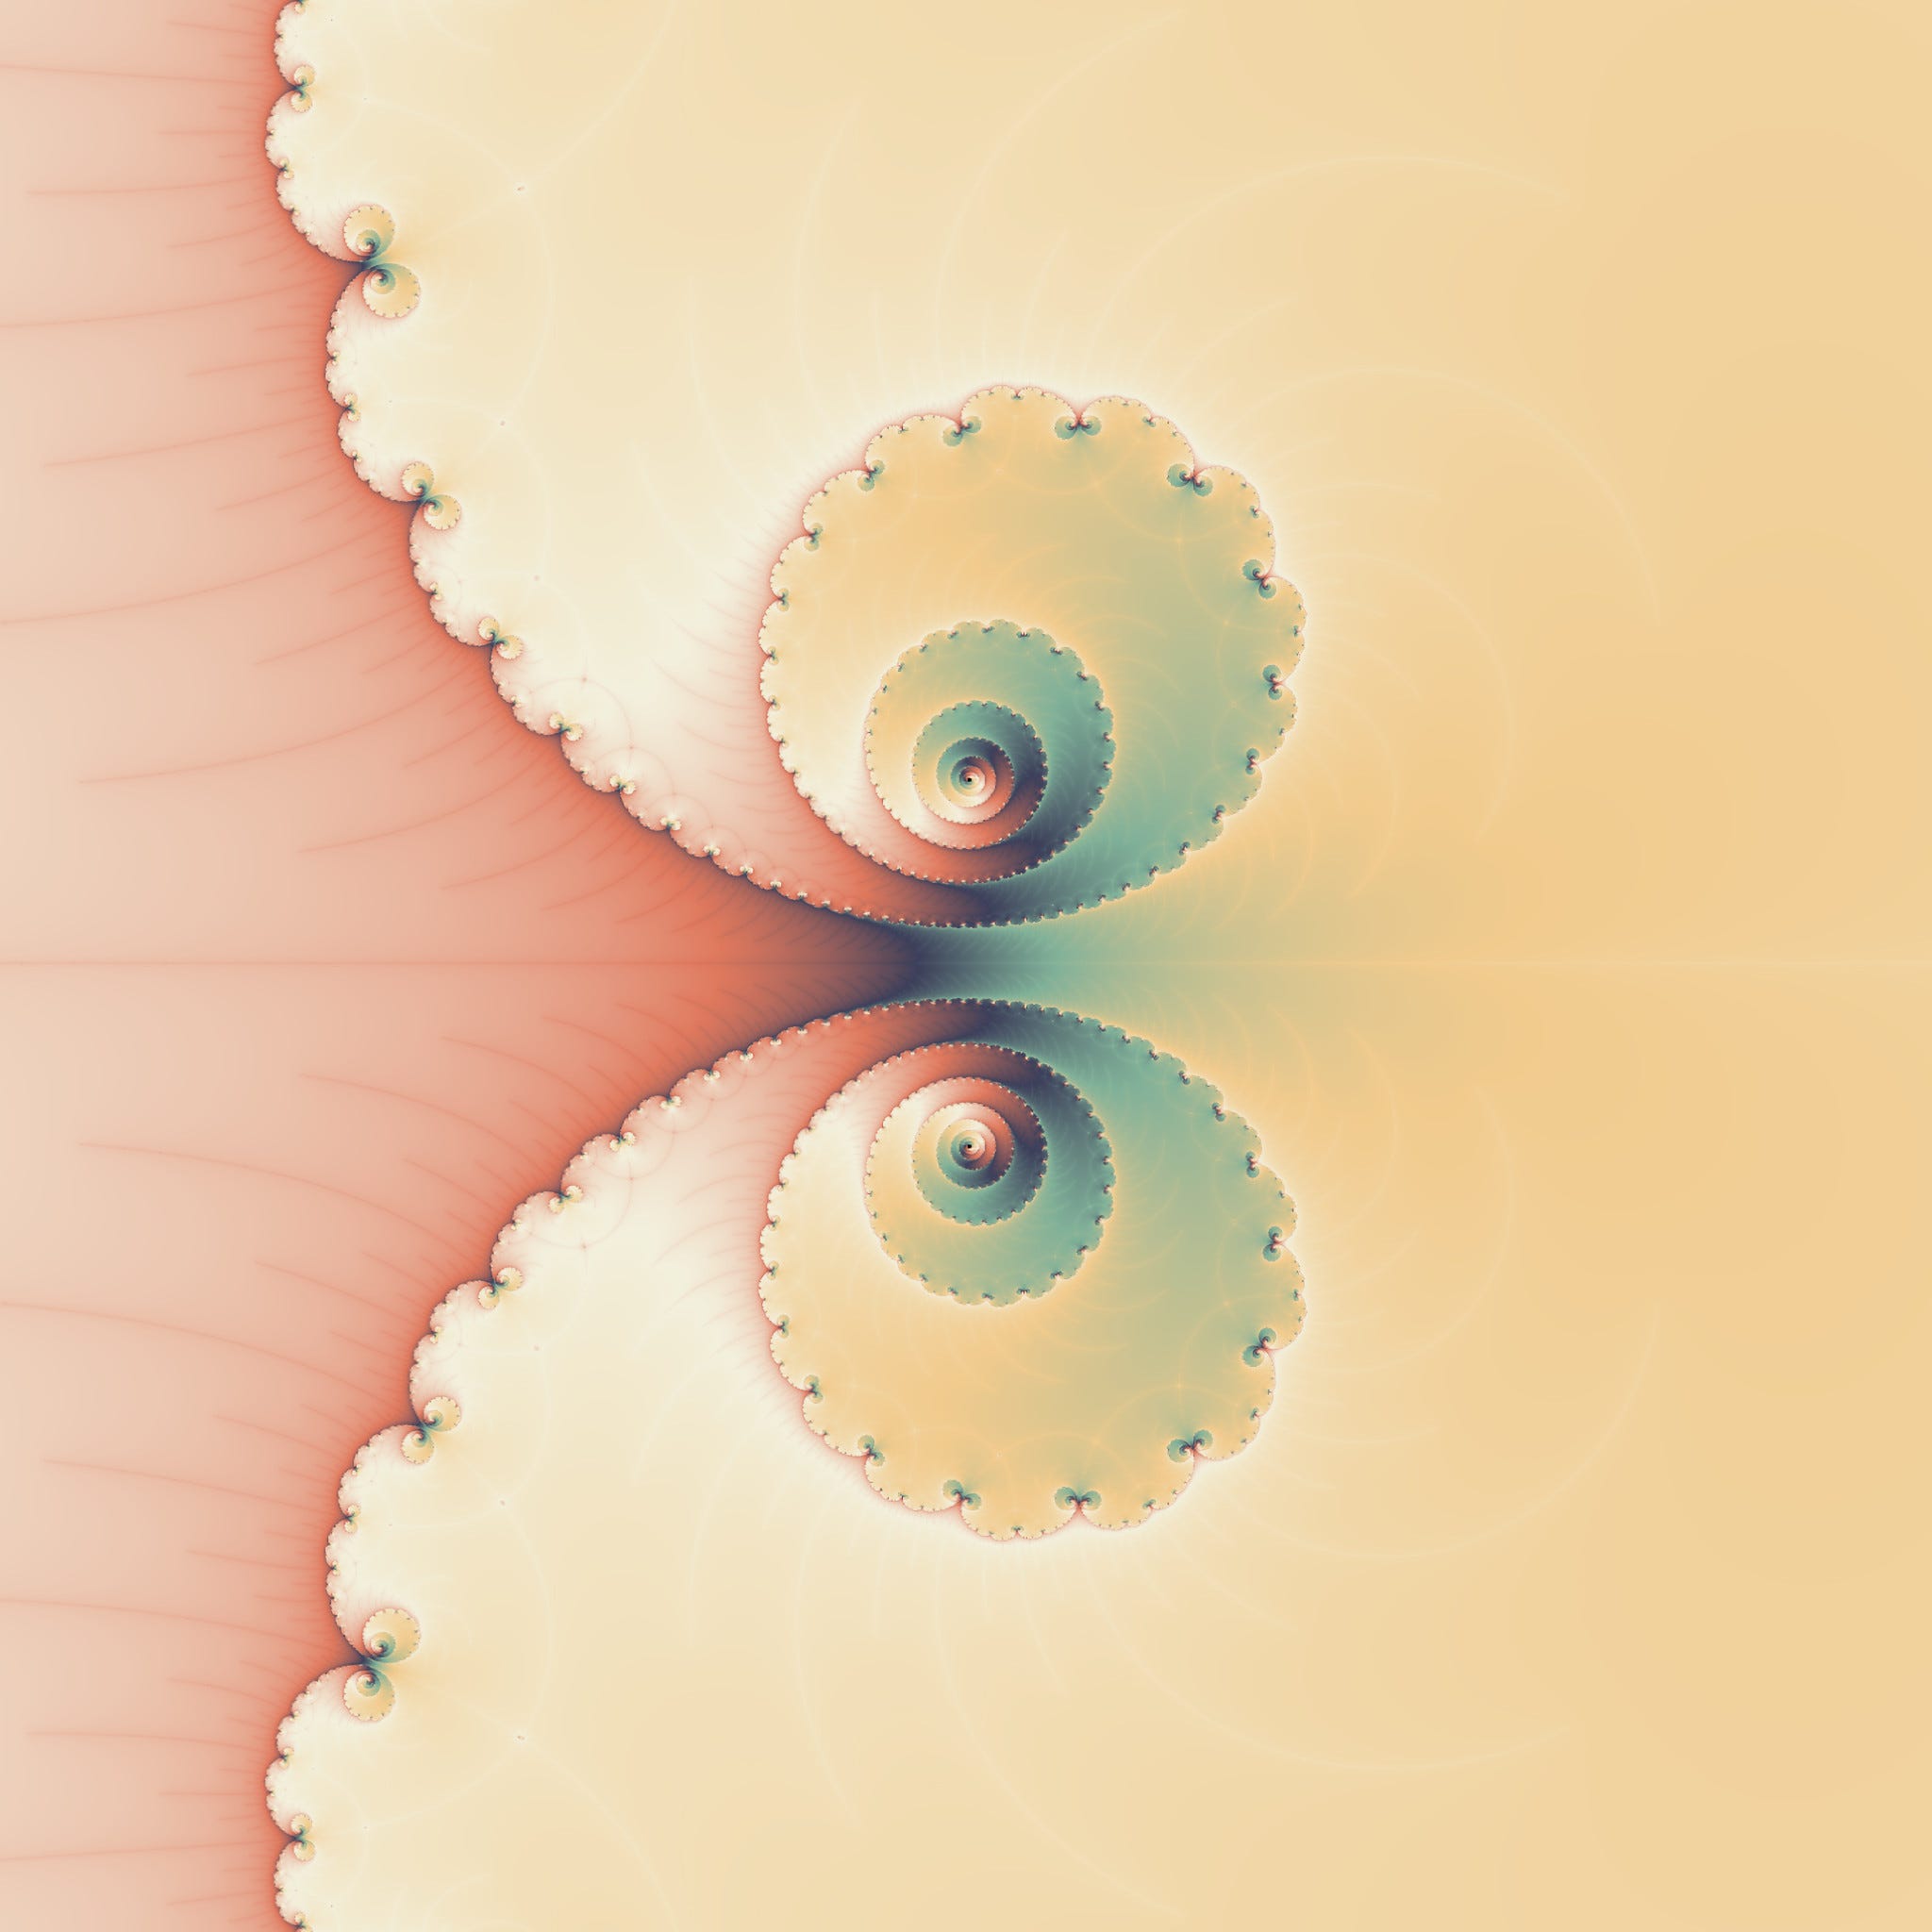
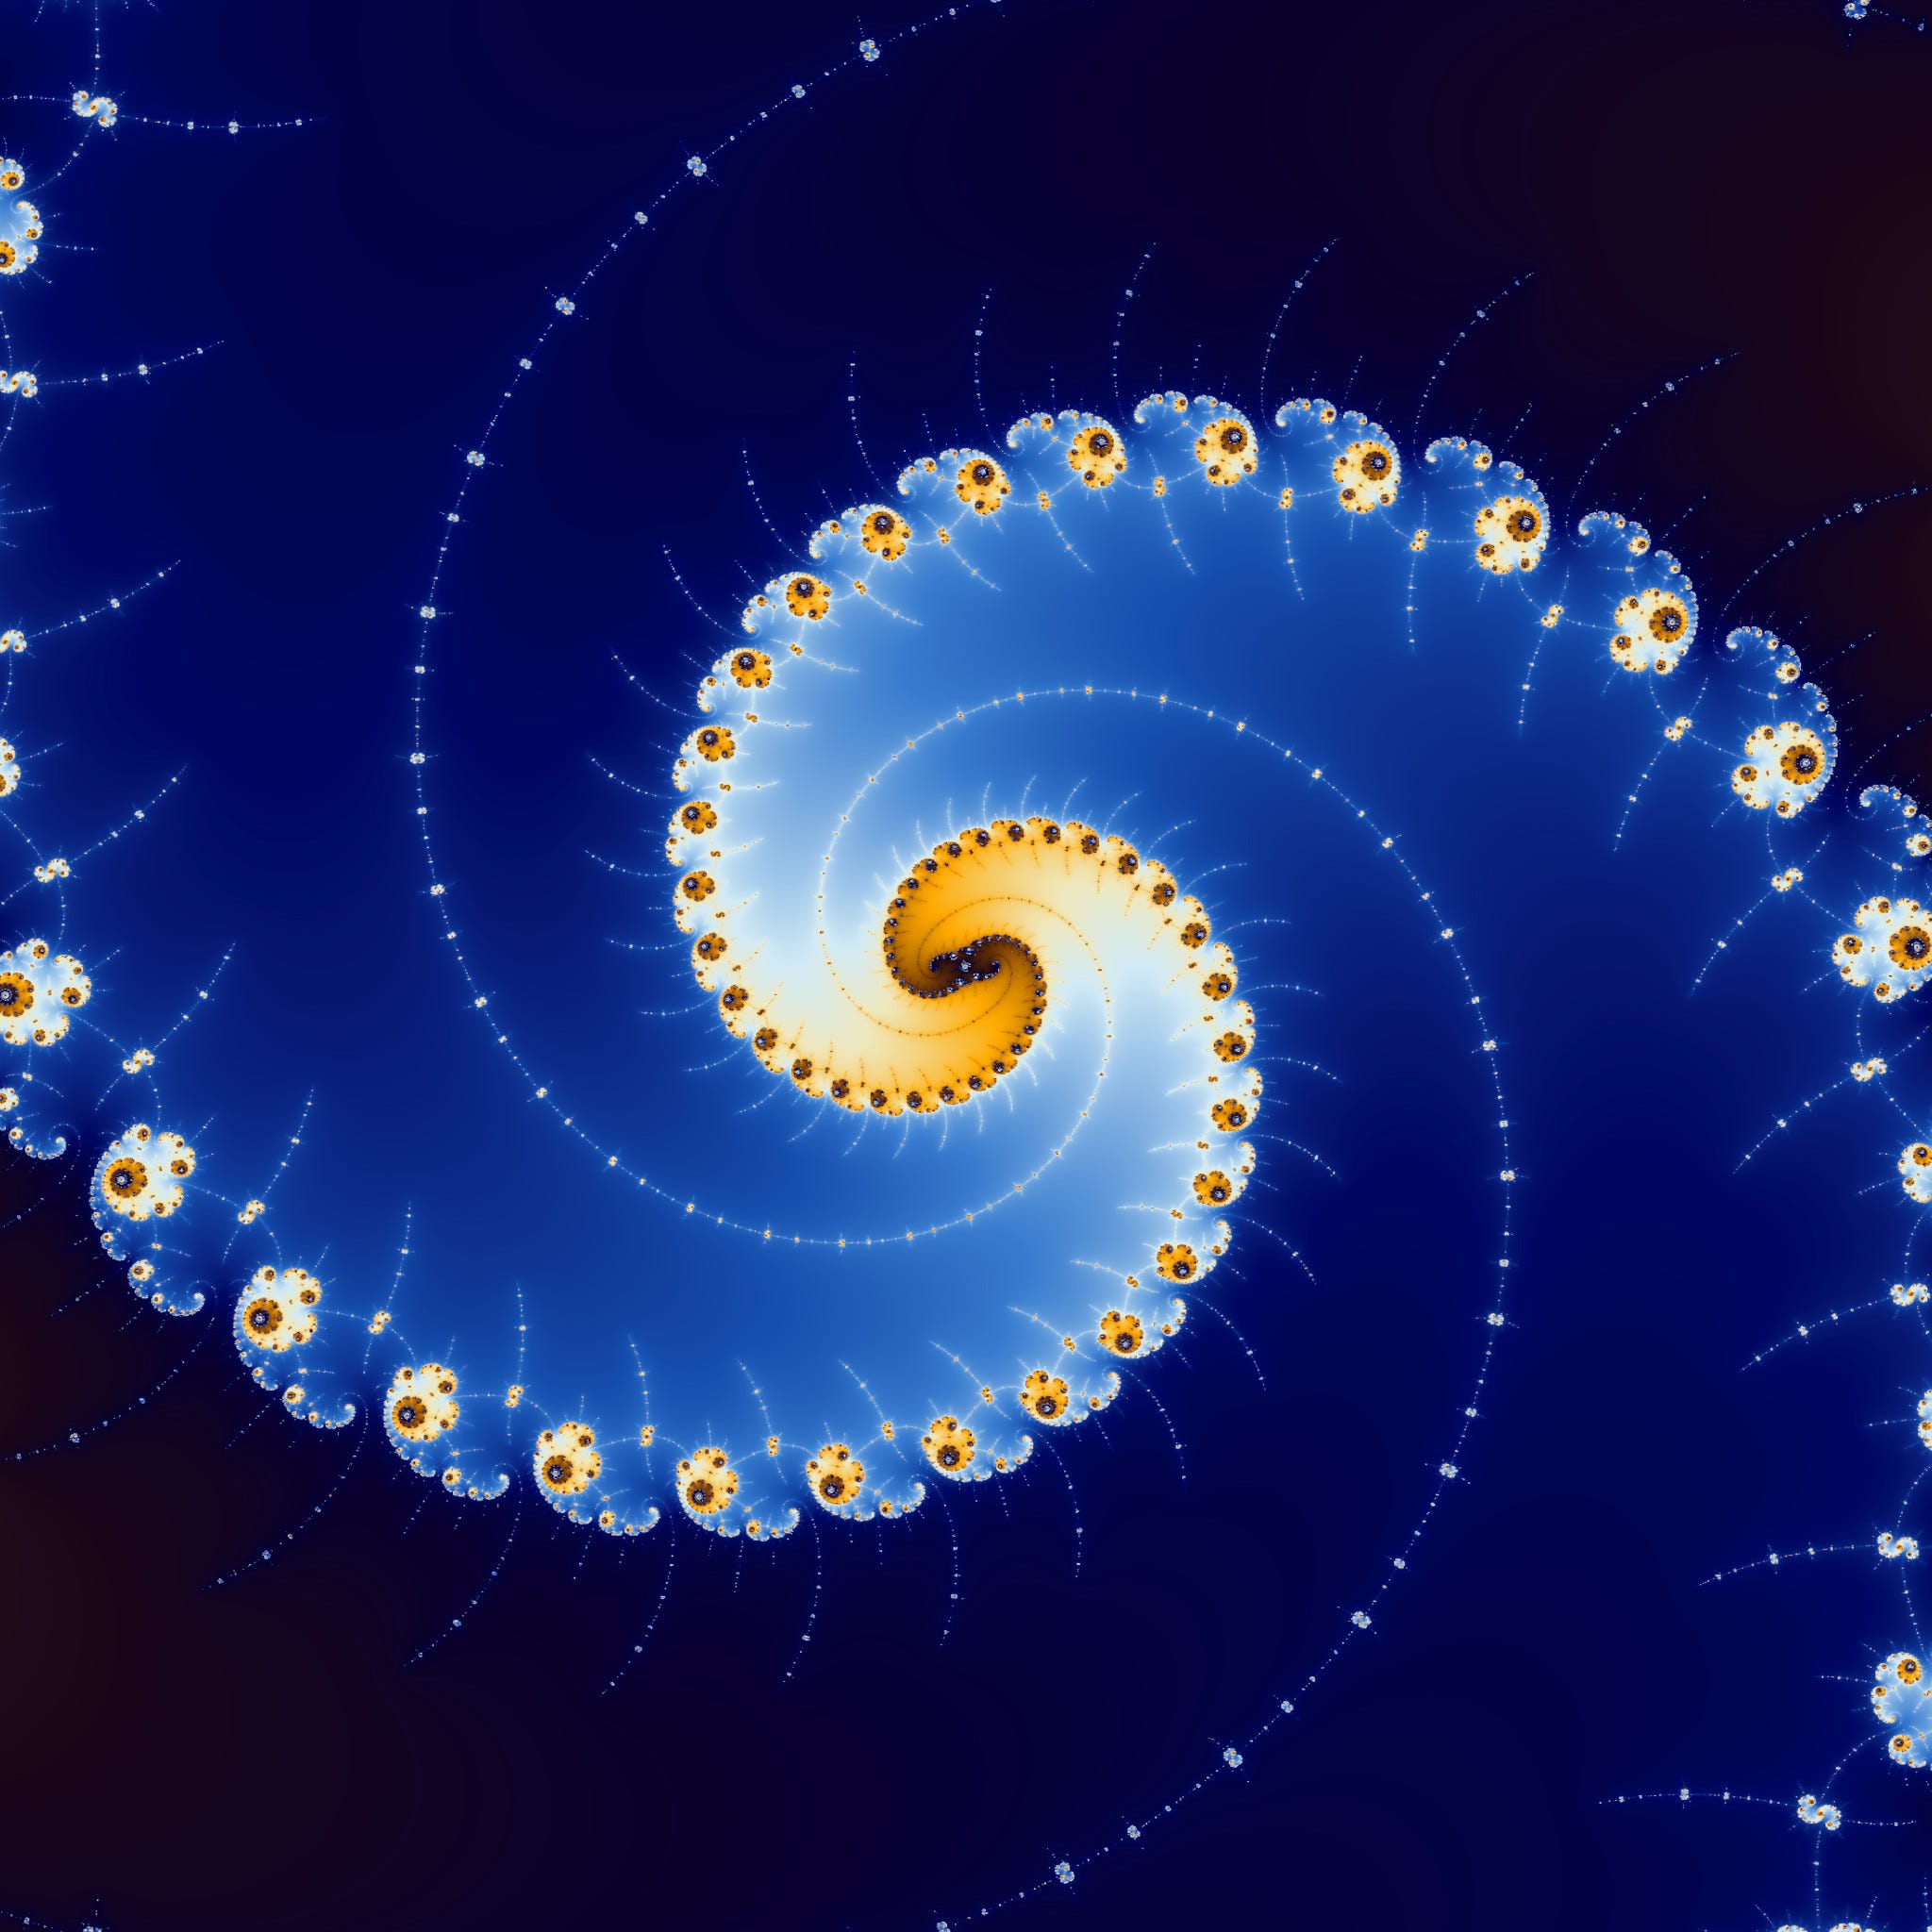
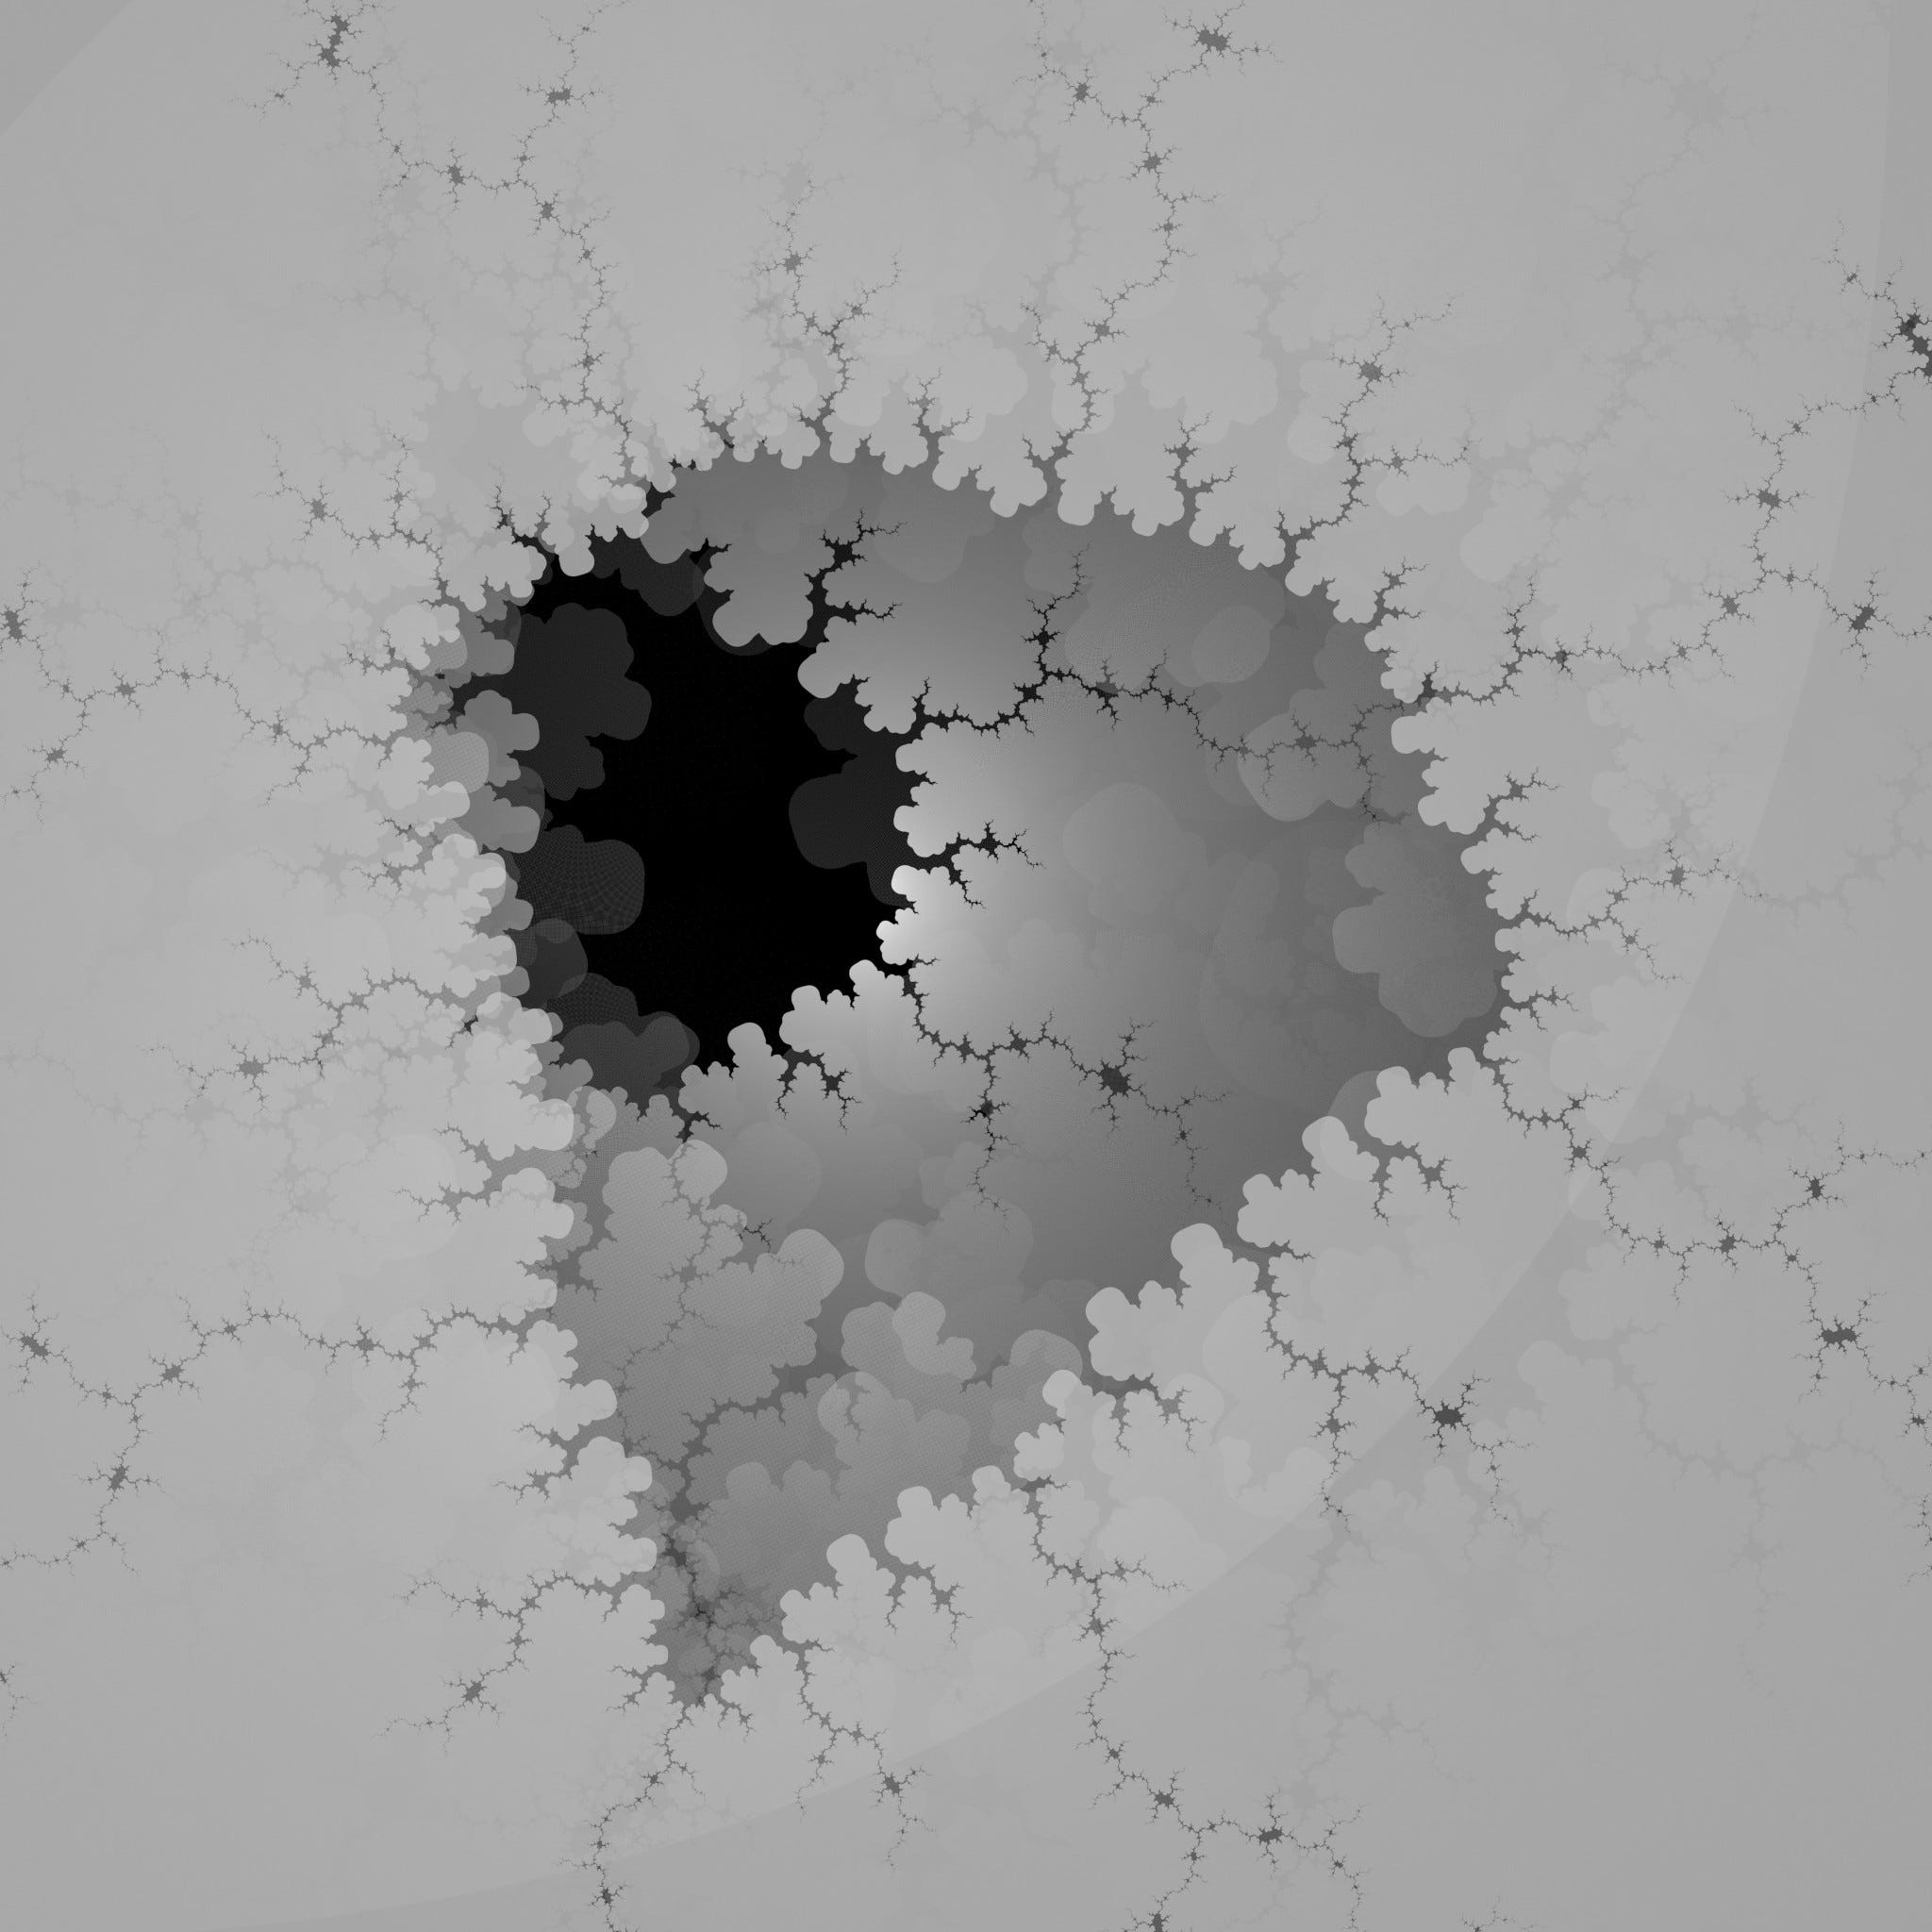
By the way, this TBBT shot is using video “Eye of The Universe”, generated and uploaded on Maths Town channel. It’s using 17 million iterations and 3.4e1091 zoom. You can find the video, as well as some cool shots from it, here: https://www.maths.town/videos/eye-of-the-universe-video
Code on GitHub, with build and usage instructions: https://github.com/leamare/mandelbrot-experiment-dlang
And if you want pretty pictures then you should check Gallery at the end here!
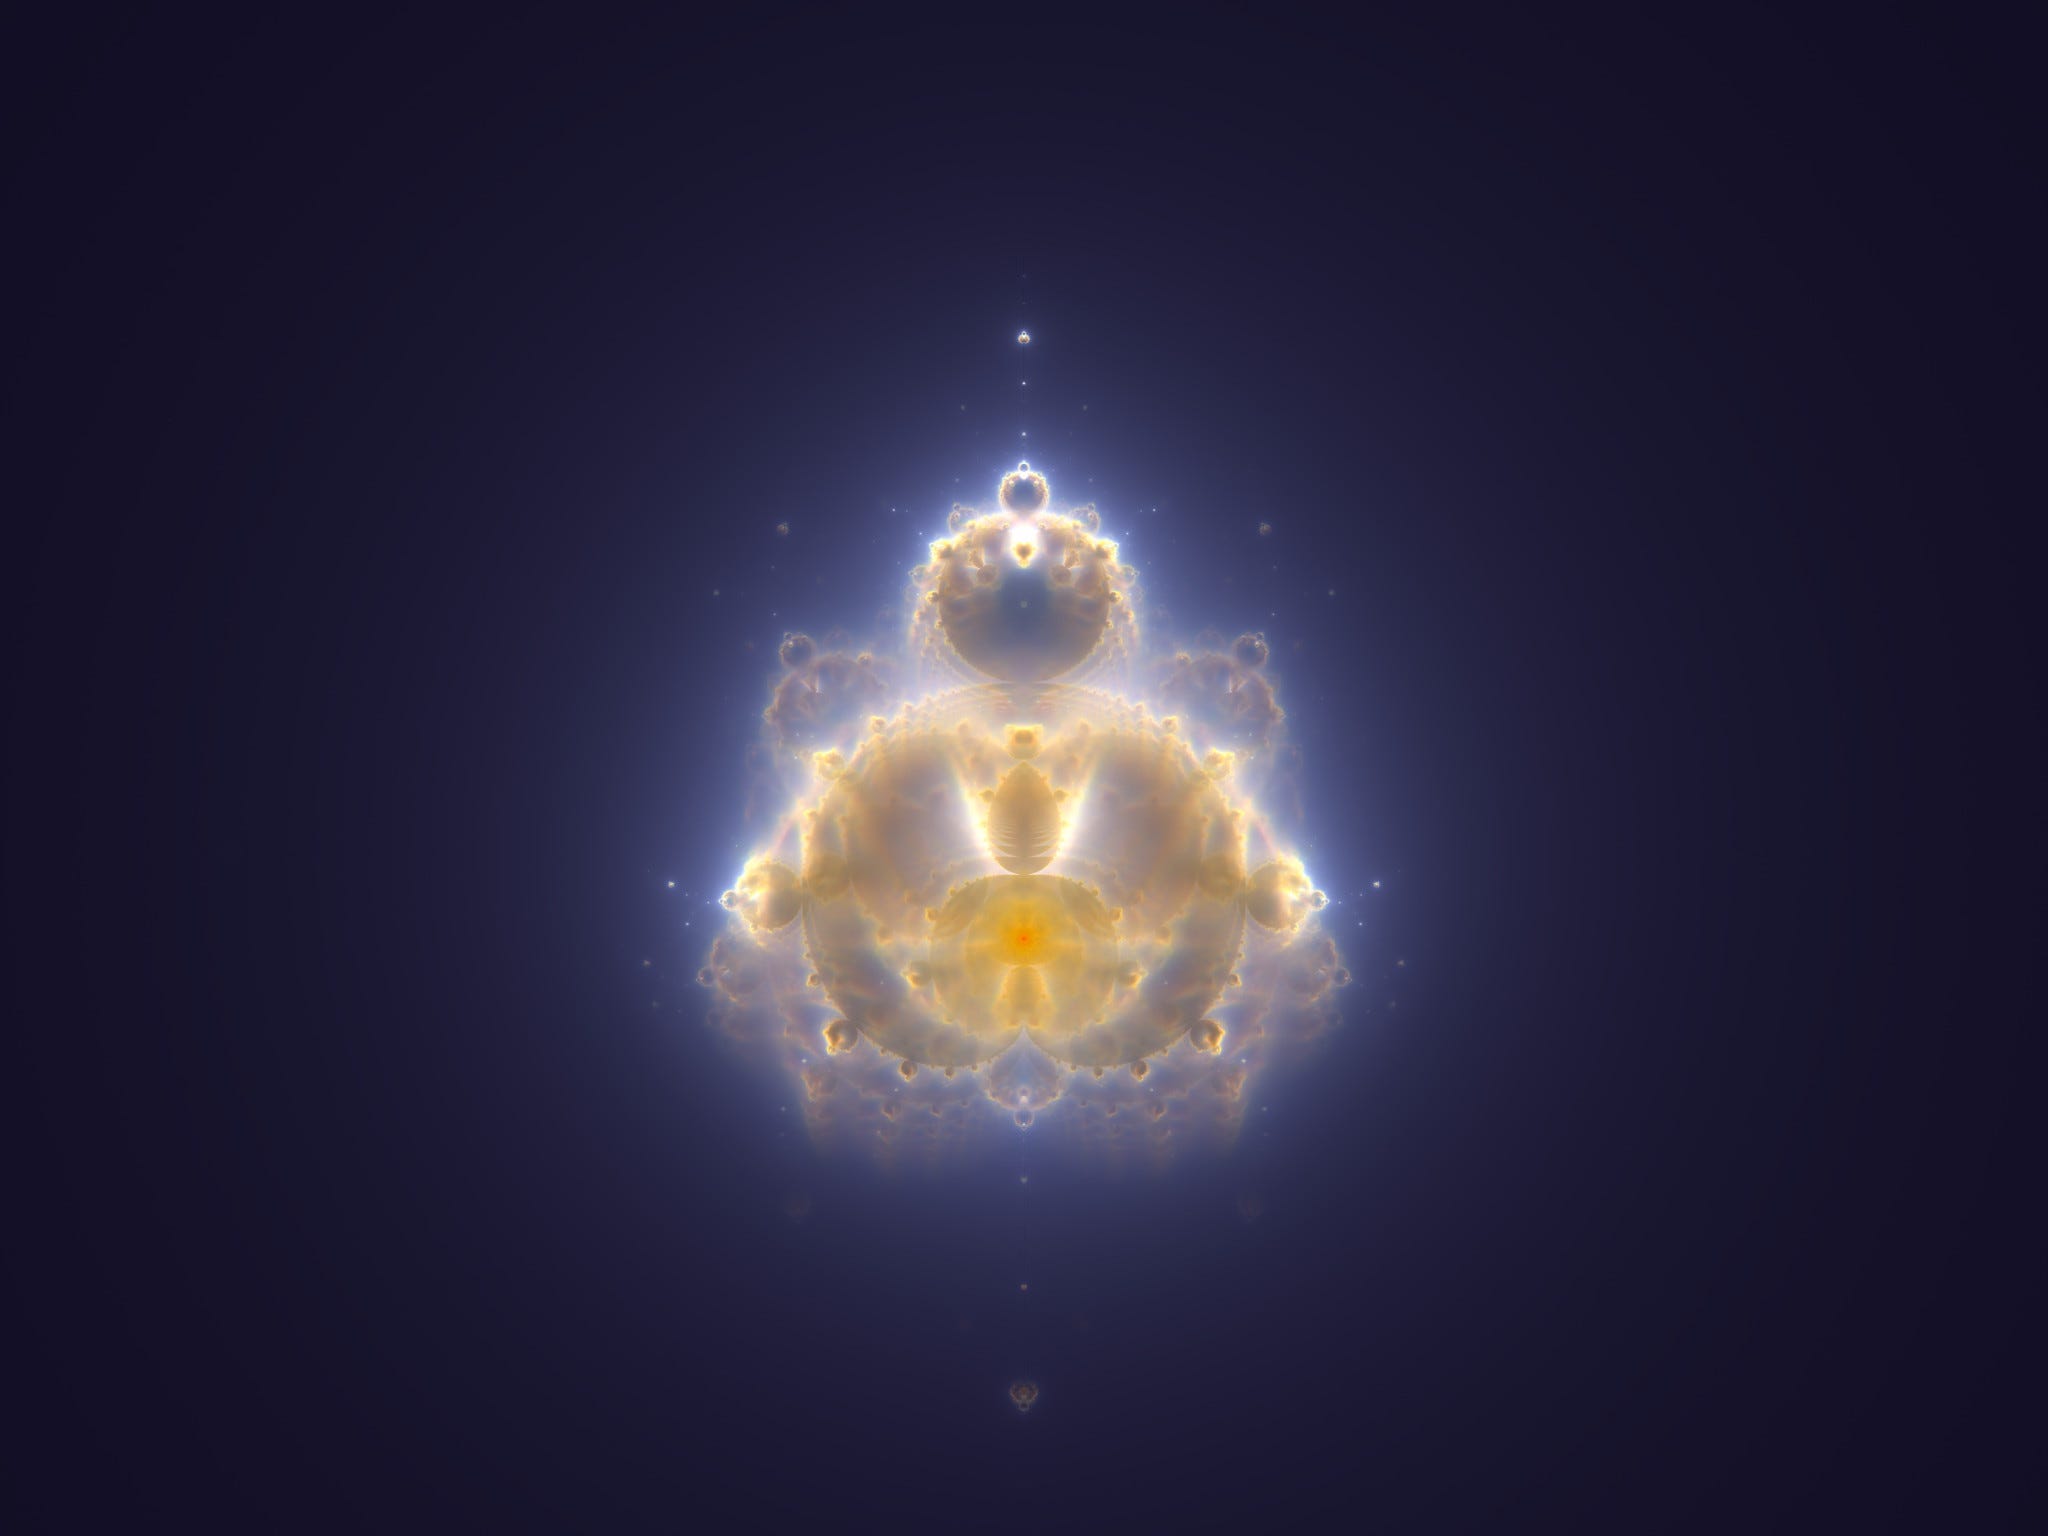
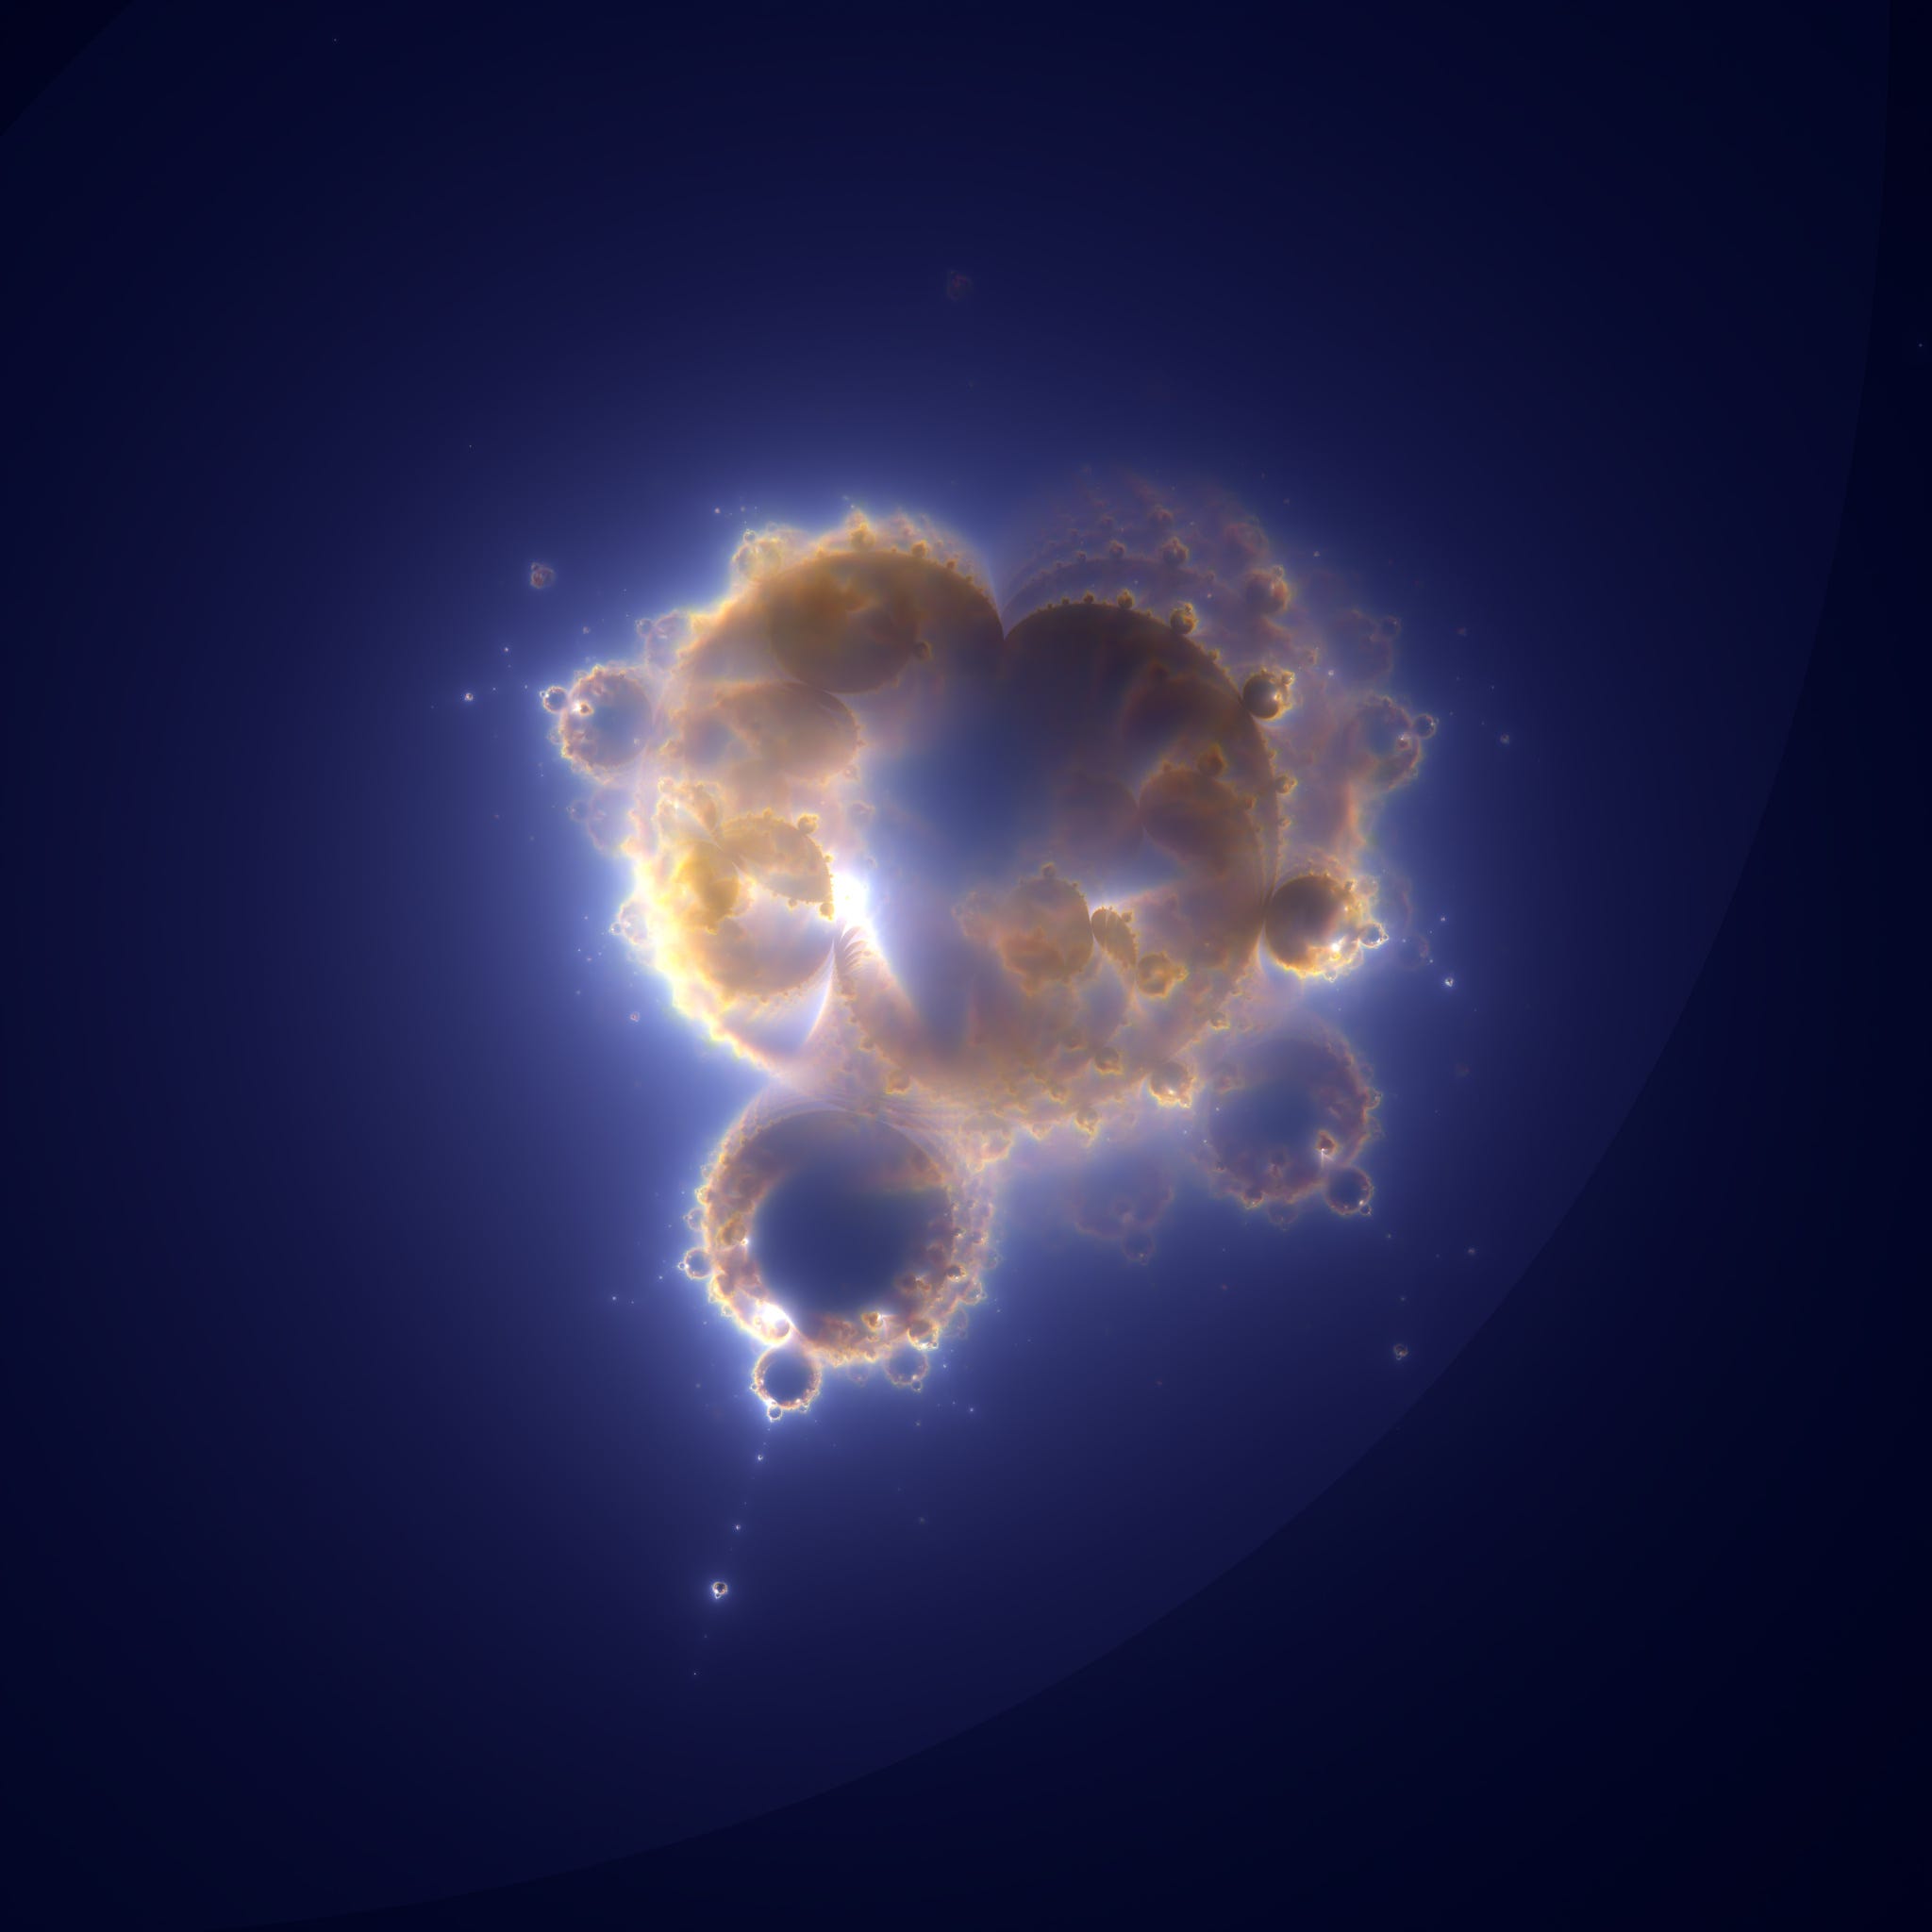
It all started with the Mathologer video about “Buddhabrot”.
I could also mention some other cool materials that made me think about this topic, like cool video by Veritasium about Logistic map or another cool video by 3blue1brown about fractals. But it’s a bit off the topic.
Let’s talk about what fractals are first. Basically, Fractals are complex structures (or sets), parts of which are similar to the fractal itself. The most basic example would be tree. If you’ll take a branch of a tree, it will look like a small tree by itself. And so on, and on, and on…

There are many different fractals (and many definitions of them, but it’s off the topic again). But the most famous one would be Mandelbrot set. It’s pretty easy to calculate using the formula

If while repeating this operation over and over again for a given number C the final result will blow to infinity, then the number is not part of the set. If you can actually find a limit for the number C, then it’s part of the set. That’s it.
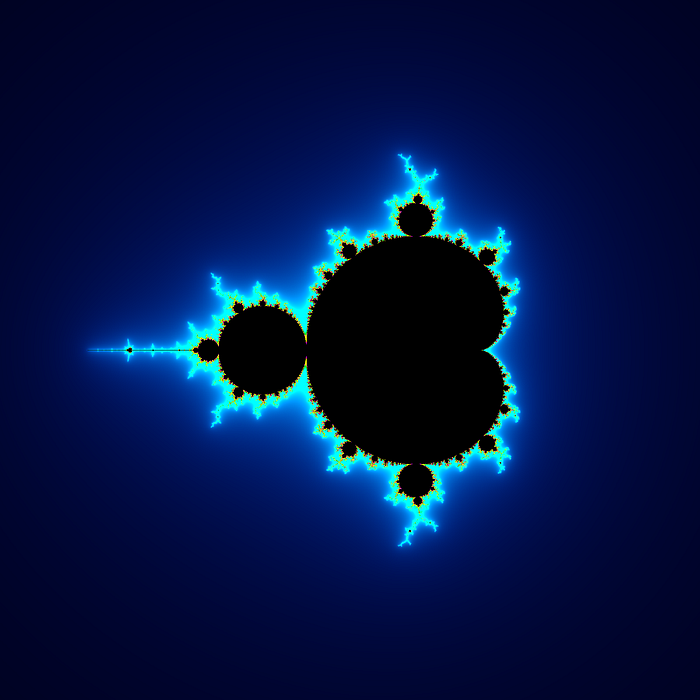
There’s also a “dwell”, which is the fancy name for the maximum number of iterations on one number. Higher dwell leads to more accurate results and more details on the plot.
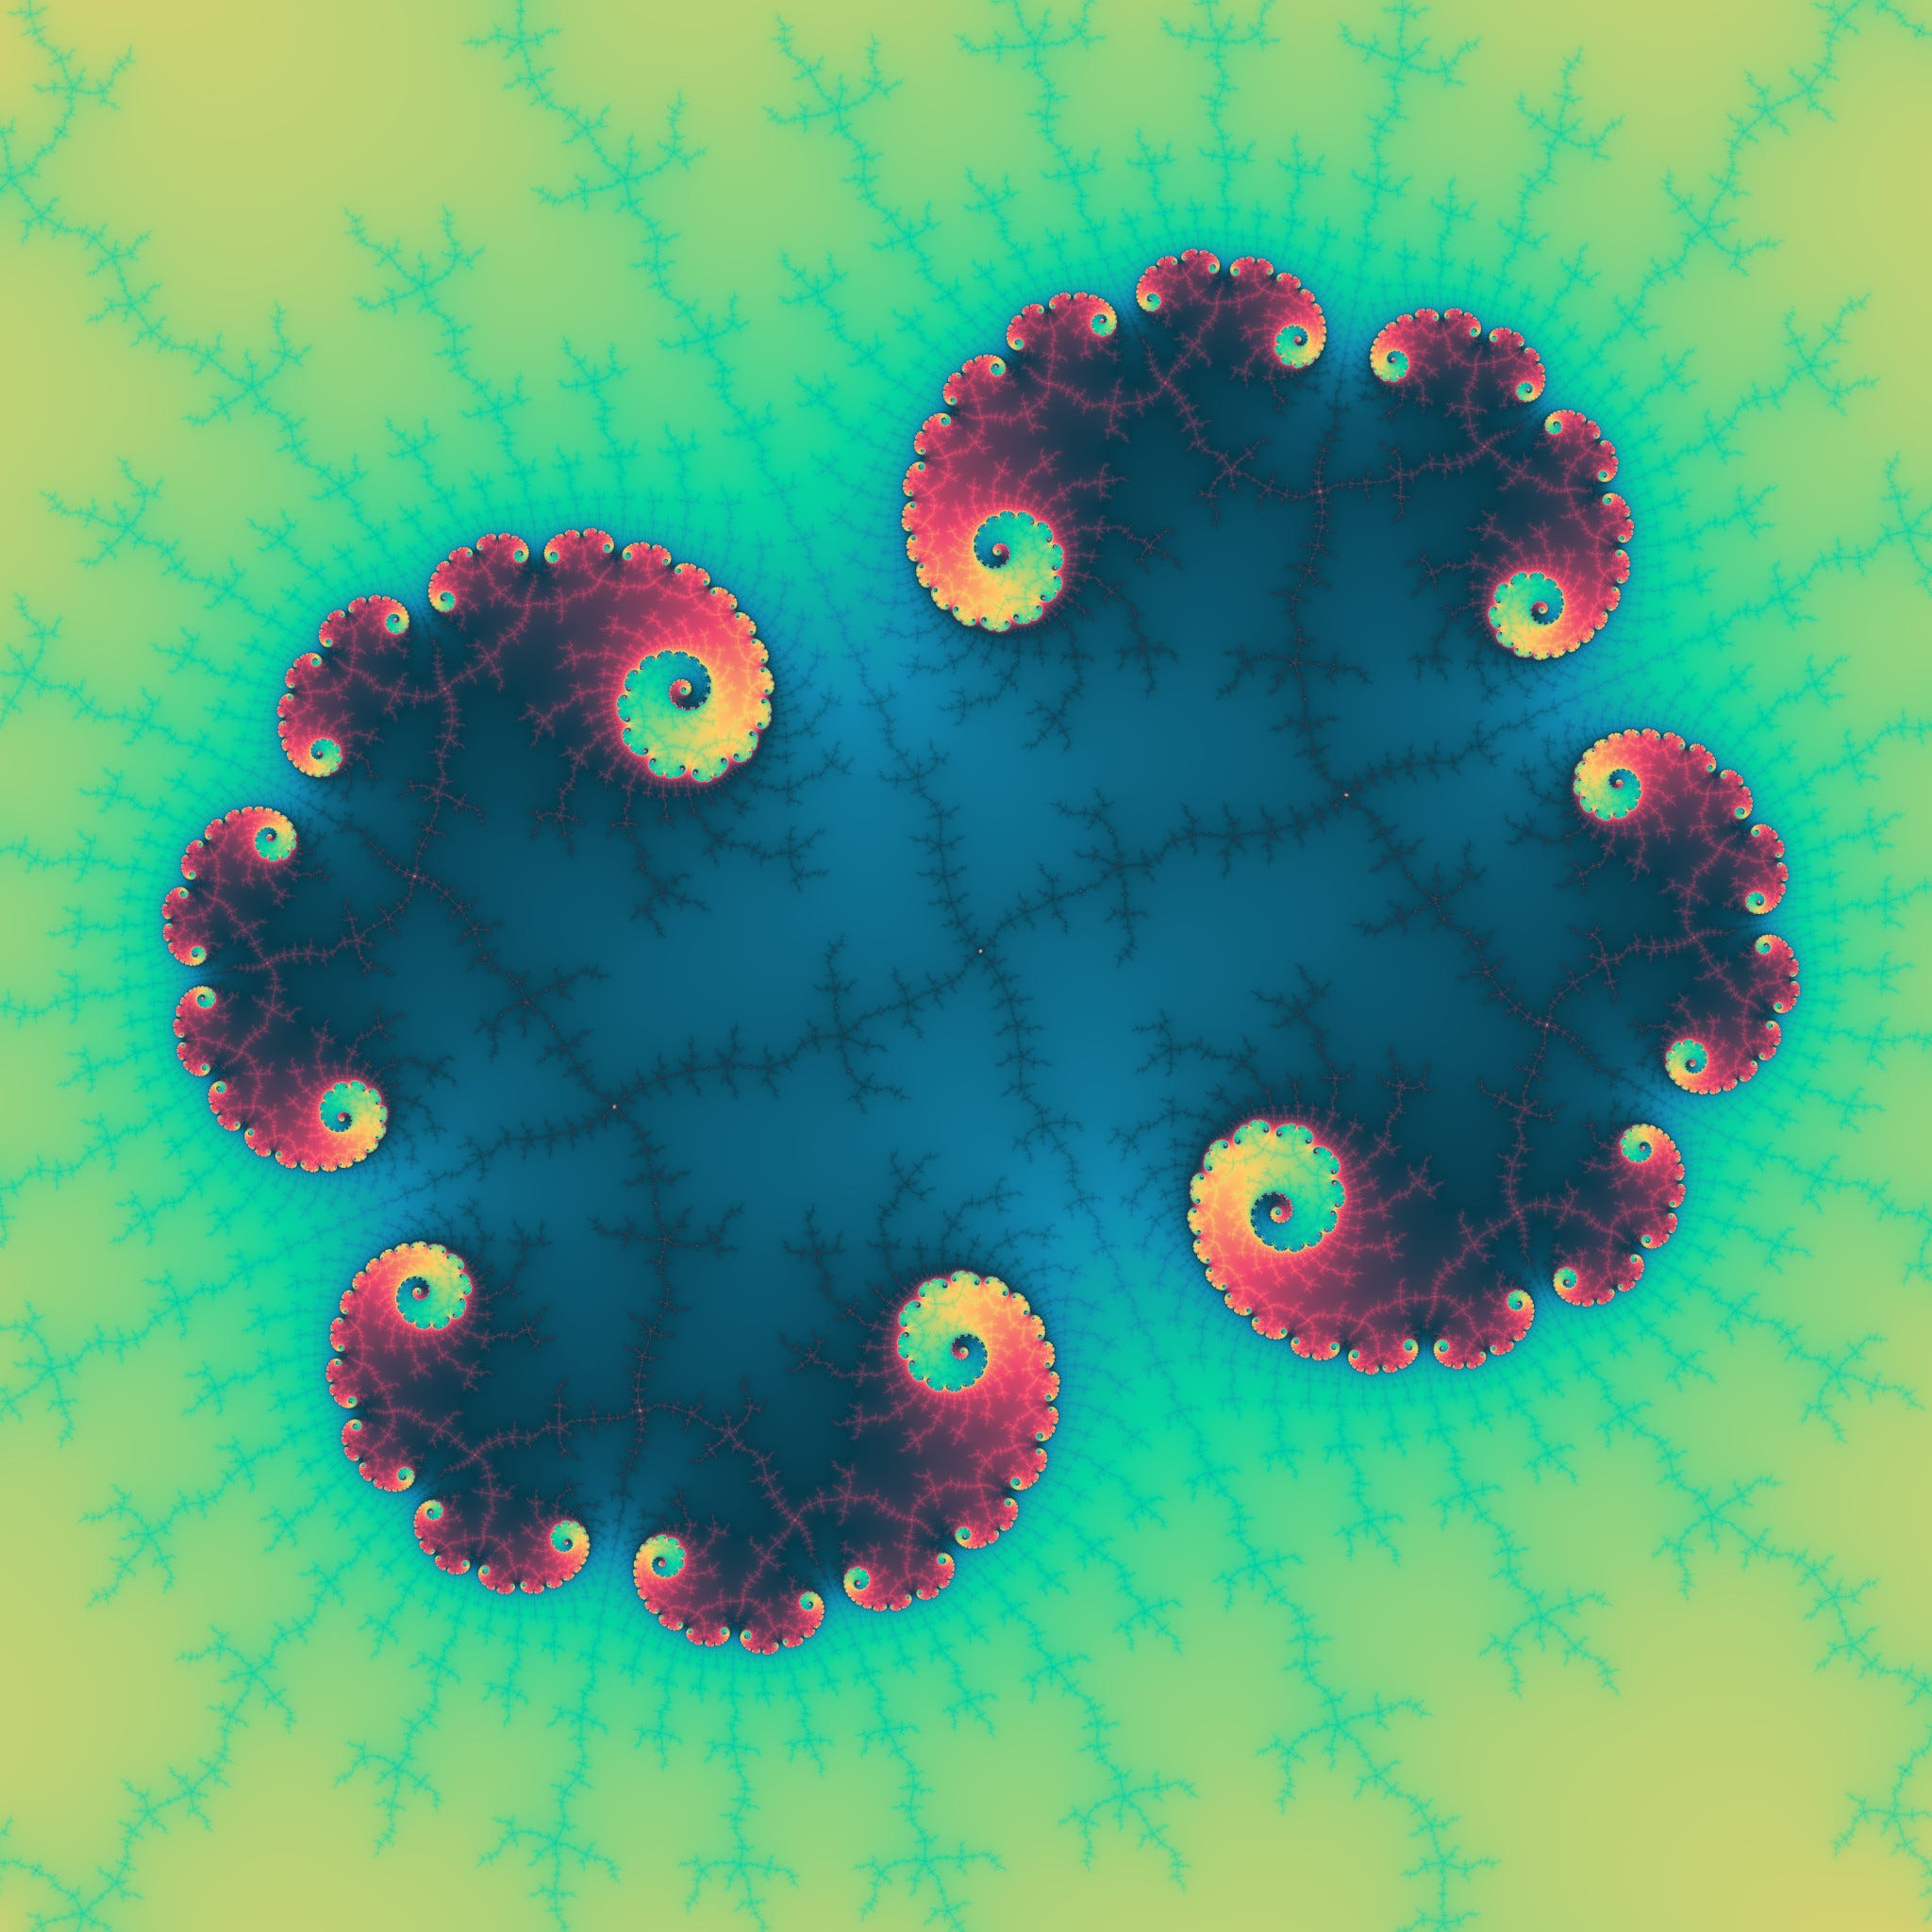
And there’s also Julia set, and you can find various states of it on the border of Mandelbrot set, like in a catalogue, but it’s not that important right now.
But if you’re interested, there’s a cool visualization of Mandelbrot-Julia sets relationship: https://www.youtube.com/watch?v=dekA3GNm6Qk
There are different variations of the set. The most famous ones are “ship” (with the power of the module of the complex number) and “multibrot” (which is a superset of “brots” with different powers of the number, mandelbrot set is a multibrot with power 2). All the techniques can be applied to them in the same way, so I’ll be mostly talking about Mandelbrot set.
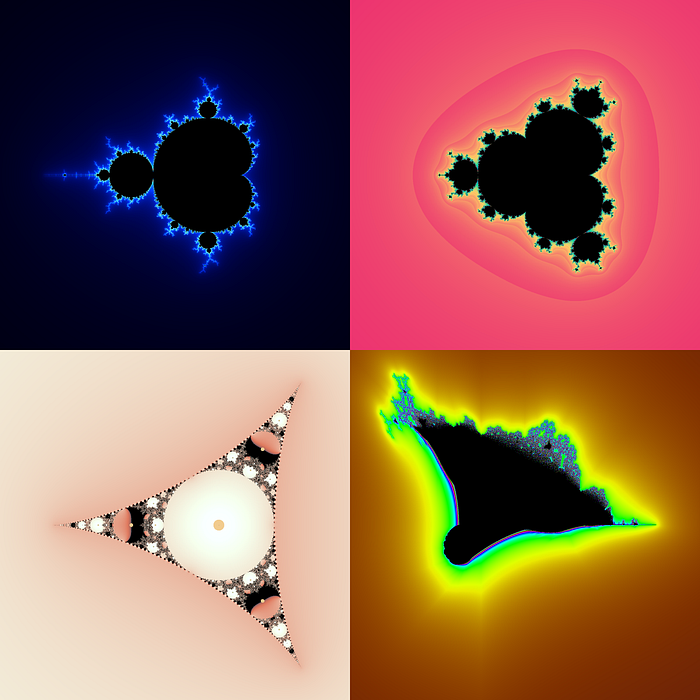
You can describe a zone of the set either by a rectangle (coordinates of zone corners) or by origin point coordinates with a “camera radius”.
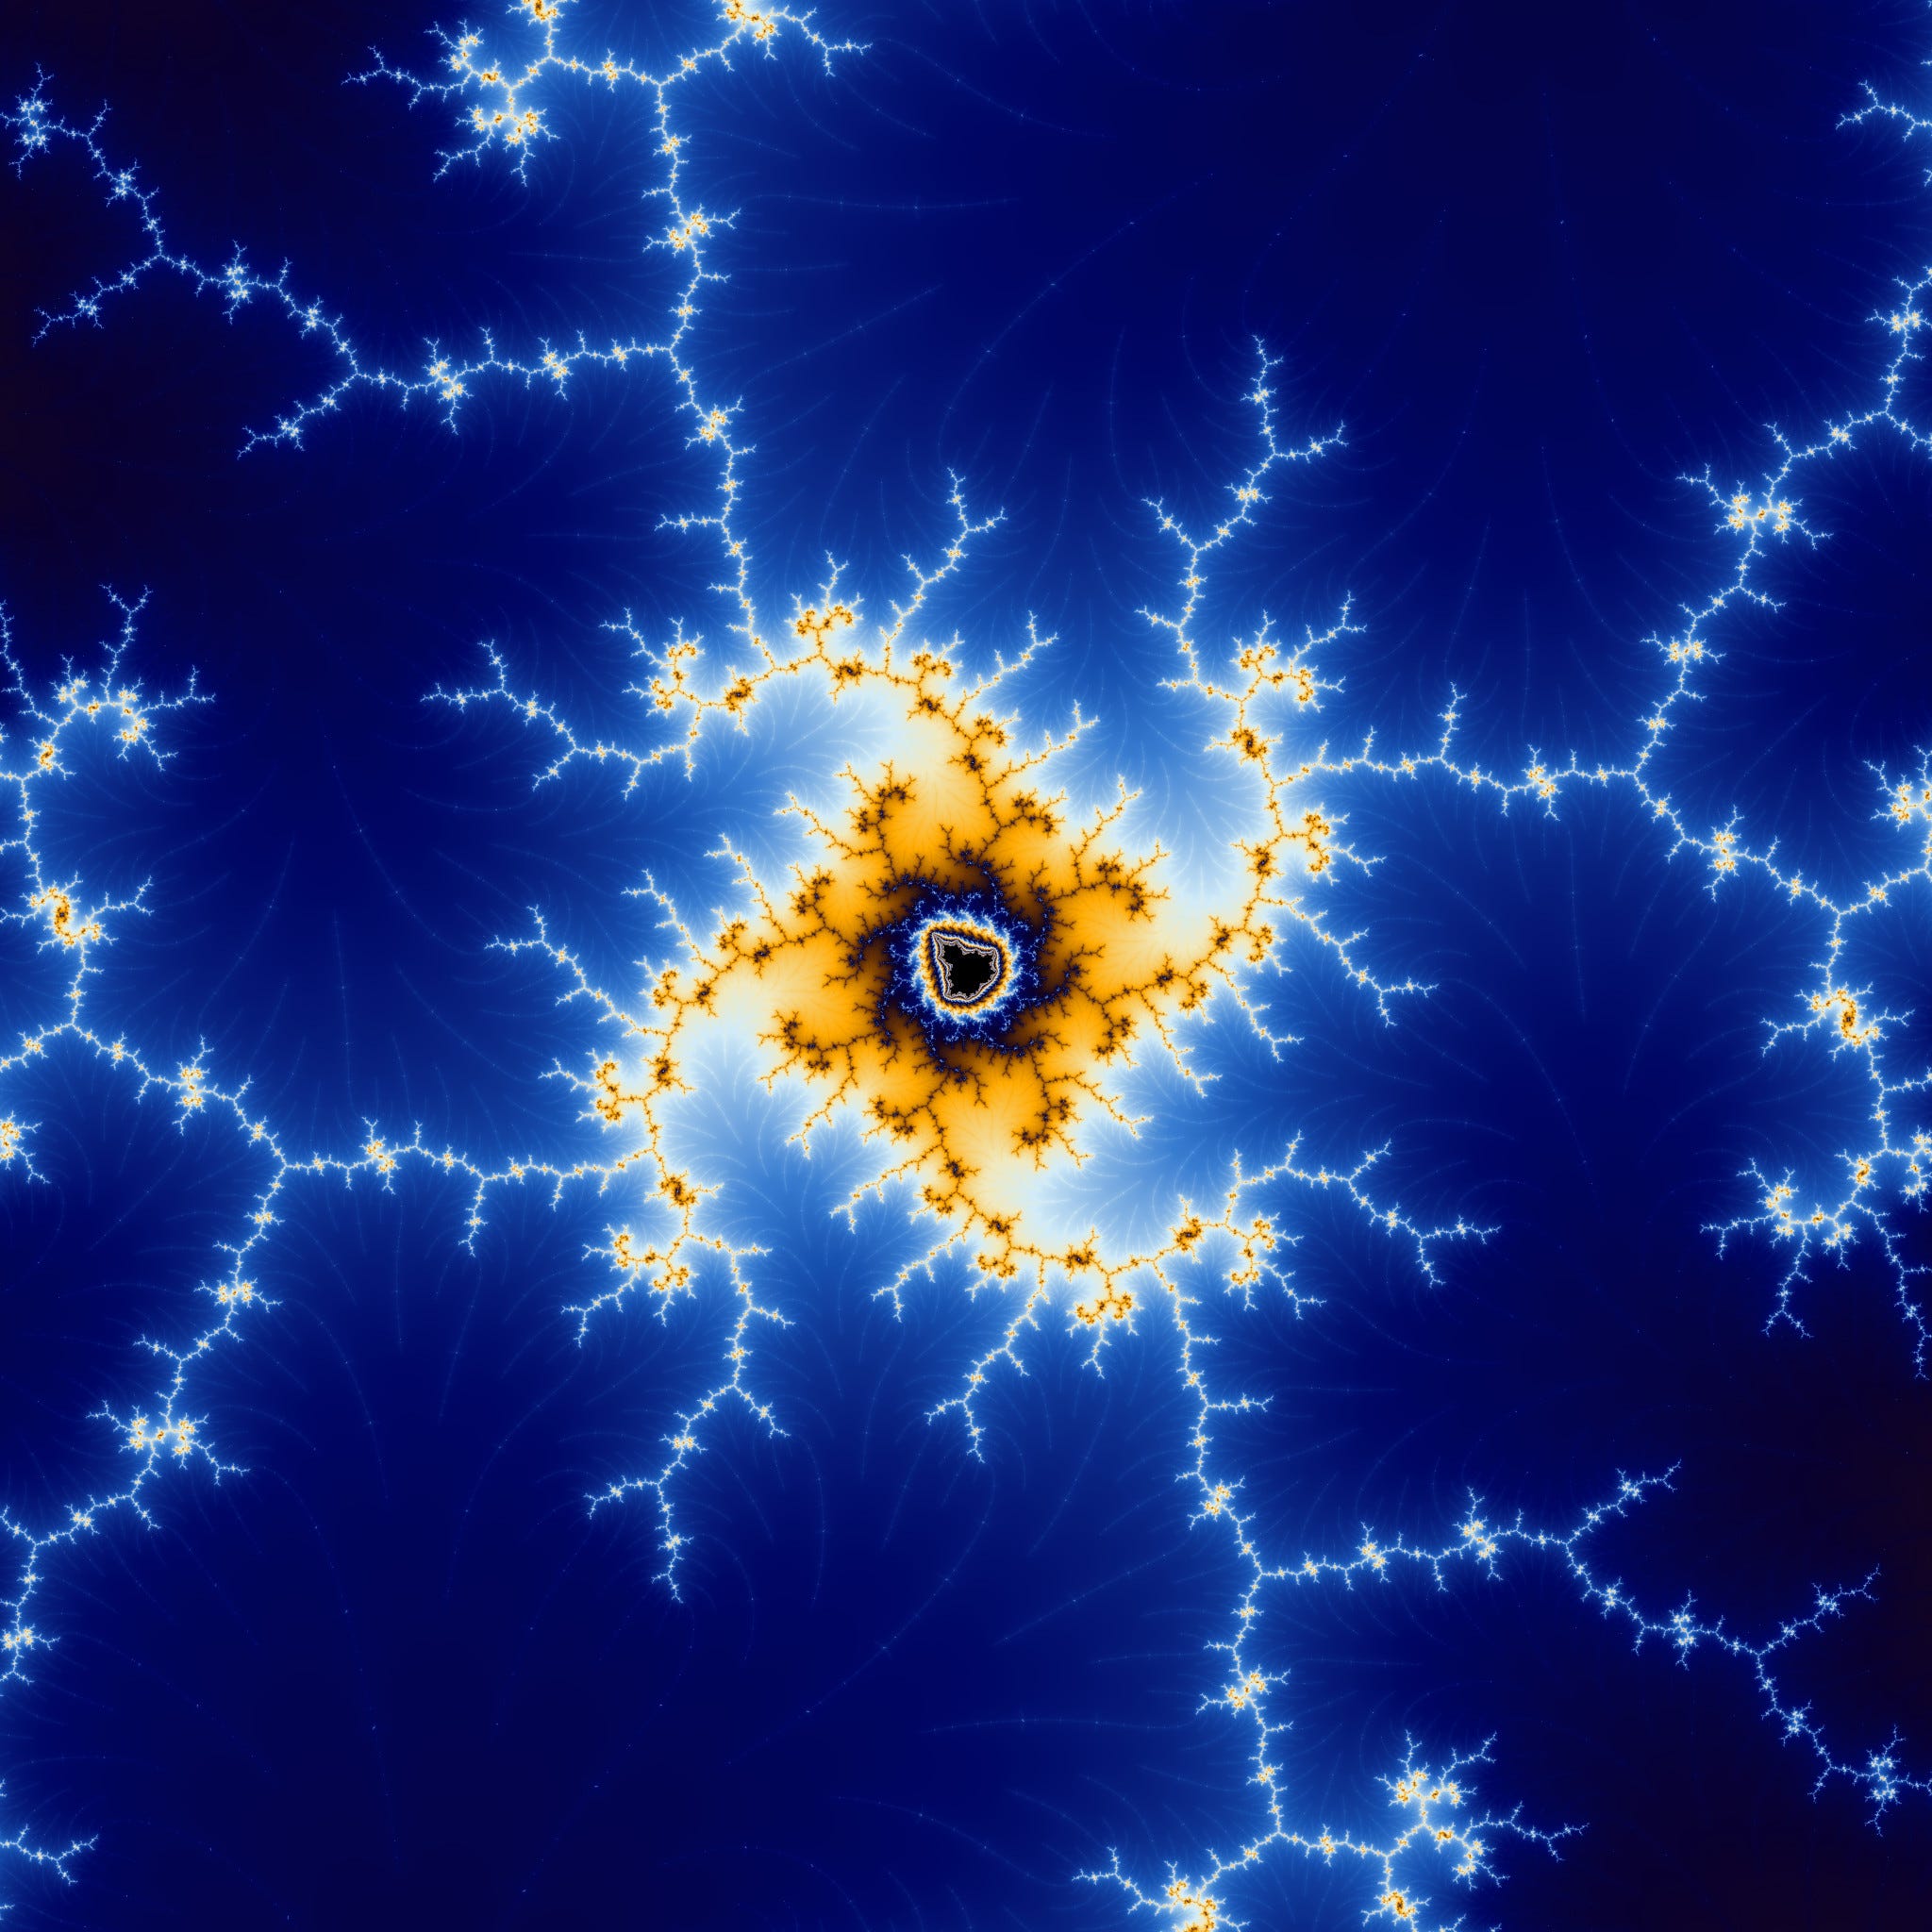
And there are also different techniques to draw Mandelbrot set (and, well, Julia set, and the ship and everything else really). You can draw points within the set as black and every other point as white. You can color them differently based on the number of iterations to reach the limit. You can also color the point based on how often a path “out of the set” lies through this point. You can even build a 3D version (or 4D, you can find some good videos about that on YouTube).
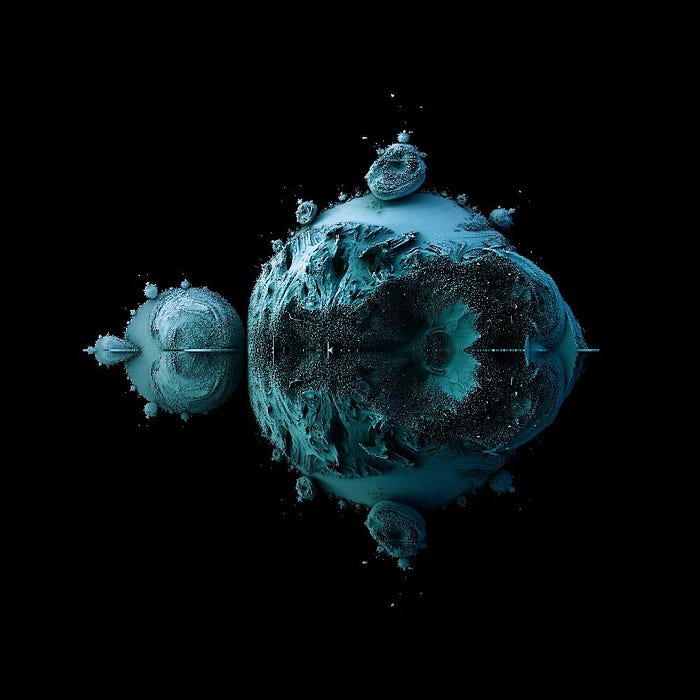
I had three techniques in my mind: color based on the number of iterations, “buddhabrot” and “anti buddhabrot” (about them later).
Coloring based on the number of iterations
First of all, the number of iterations is integer, so images you get as results won’t be… the most beautiful once, so to speak. It would look much nicer with continous coloring.
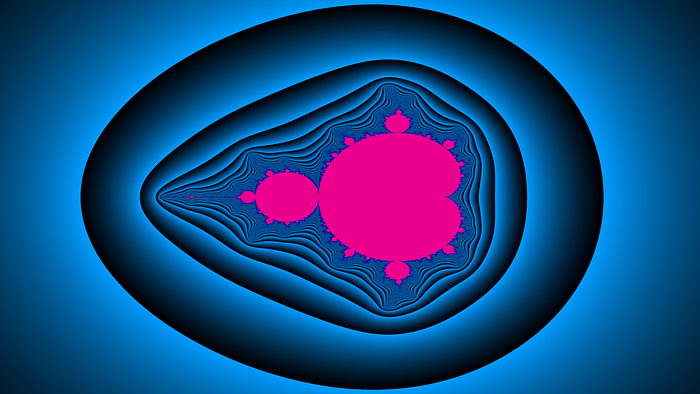
But there’s a solution. We can just use some natural logarithms magic to get the zmooth gradient between two closest colors:
iter_d = iterations + 1 - (ln(2) / |Z[n]|) / ln(2)
Or an actual code:
const double log_zn = log(Zr*Zr + Zi*Zi) * 0.5;
const double nu = log( log_zn / log(2.0) ) / log(2.0);
iter_d = 1 + to!double(iter) - nu;
You can speed it up even more by calculating log(2.0) beforehand, but it’s whole another story.
And what should we do with colors?
There are two approaches to this problem. You can use pre-calculated gradient palette OR calculate the color from the number.
The first approach is rather simple: we look for the closest two colors of the gradient, then calculate the closest color between them for the given value.
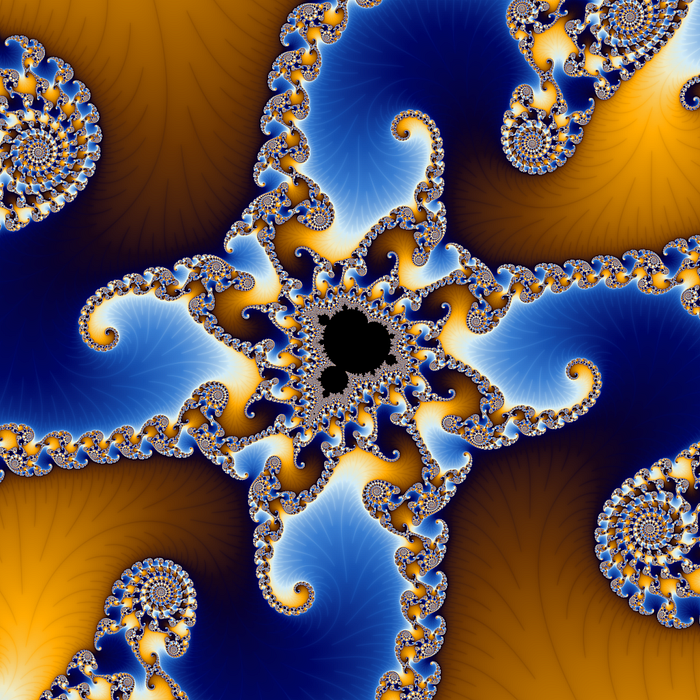
There are also some popular gradients cool kids use for fractals, like “Earth and Sky” (aka ultrafractal, it’s used on wikipedia), if you’re looking for the key points for these, you can look into my code. I have these gradients hard coded into the
mandel.dfile. There are some more custom gradients, too.
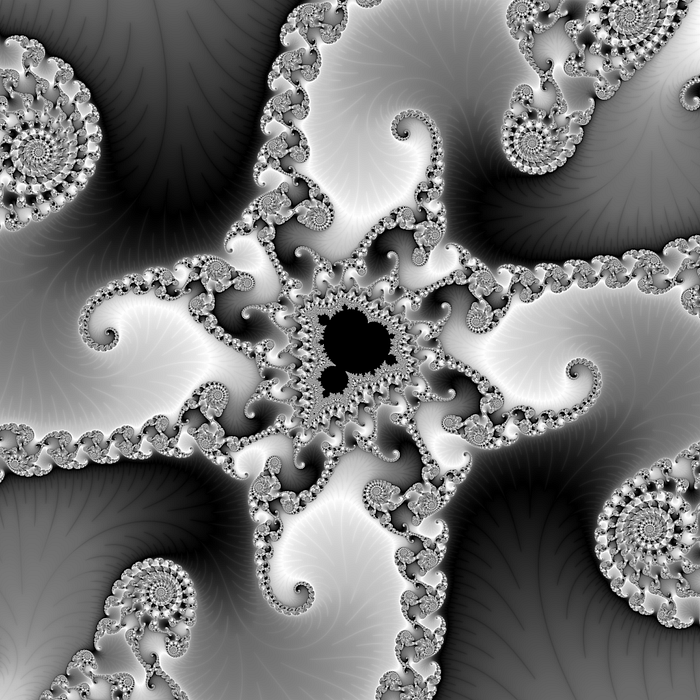
The second case is a bit more interesting. There are different approaches within it as well.
For example, you can just “assign” a shade of gray to every point (RGB color with the same number on all channels).
But the gradient will only move one way, and if you want it to look cool, you need to make it bidirectional.
// like this
auto v = 2*(iter_d/paletteSize) % 2; // source value, can be useful later while calculating
const auto vc = v > 1 ? 2-v : v; // "turned" color
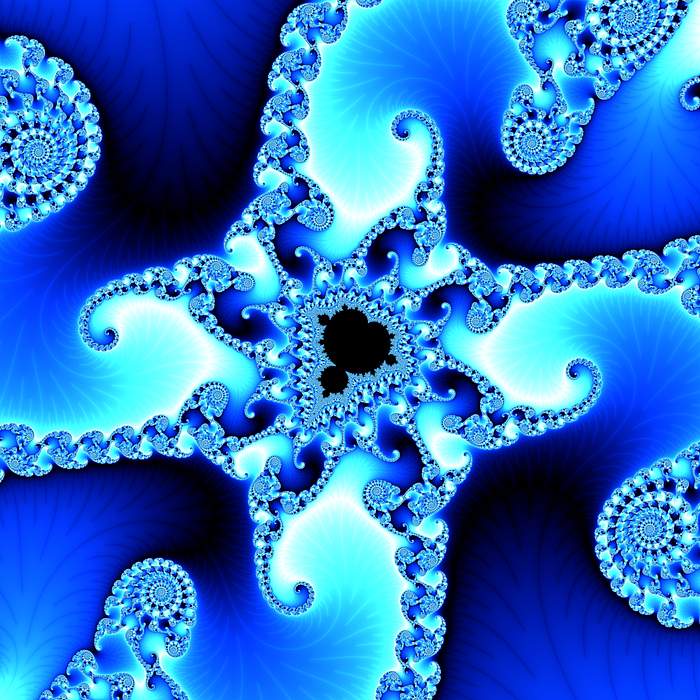
And if you want to color it, you can just use only one channel (Red/Green/Blue) instead.
But it doesn’t really look as nice with this simple approach, so it’s better to find some nice multipliers to assign to other channels, so the picture won’t look as dark.
You can look for my multipliers for Fire Red and Ocean Blue generated gradients in the same
mandelmodule, functionpixelcolor()
The most interesting part is using HSV to generate colors. While in RGB colorspace every color is divided into red, green and blue channels, in HSV the first value sets the hue (usually set as an “angle” or a position on a circle), second sets saturation and third sets the value. But it would be stupid to just feed the v value to these three channels, as with gray gradient. For that you need some additional adjustments, dependant on the library you’re using to work with HSV. I’ve got the best result with this:
const auto vc = v > 1 ? 2-v : v;
auto vl = 0.25+vc*2;
auto vl = 0.25+vc*2;
auto vs = 0.75+vc*2;
auto c = hsv(
 360.0*v,
 vs > 1 ? 1 : vs,
 vl > 1 ? 1 : vl
);
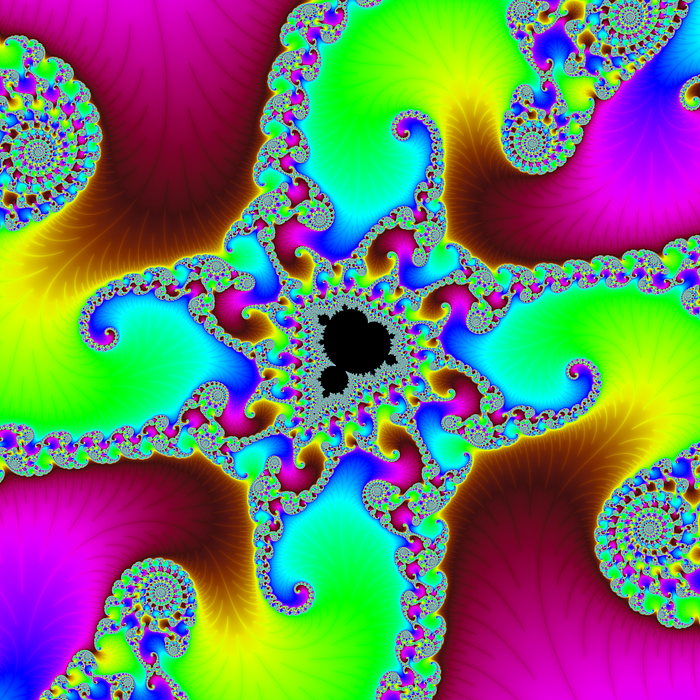
There’s another problem you need to keep in mind: aliasing. Most of the time people just calculate the source image with a twice higher resolution, then downscale the image. I decided to just ignore this part (I can generate the bigger image and downscale it any time I want, why bother).
And if you were looking for some cool gradients (including “the one from wikipedia”), here are some that I (hardcoded) in the mandel module:
- ultrafractal, aka “Earth and Sky”
- seashore
- fire and oceanid (gradients based counterparts of Fire Red and Ocean Blue)
- cnfsso (gradient suggested by cnfss0)
- acid (another gradient from cnfss0)
- softhours (and the last one, although, it’s too hard to see)
And, again, there are versions of HSV based coloring, grayscale and blue/red palettes.
Buddhabrot
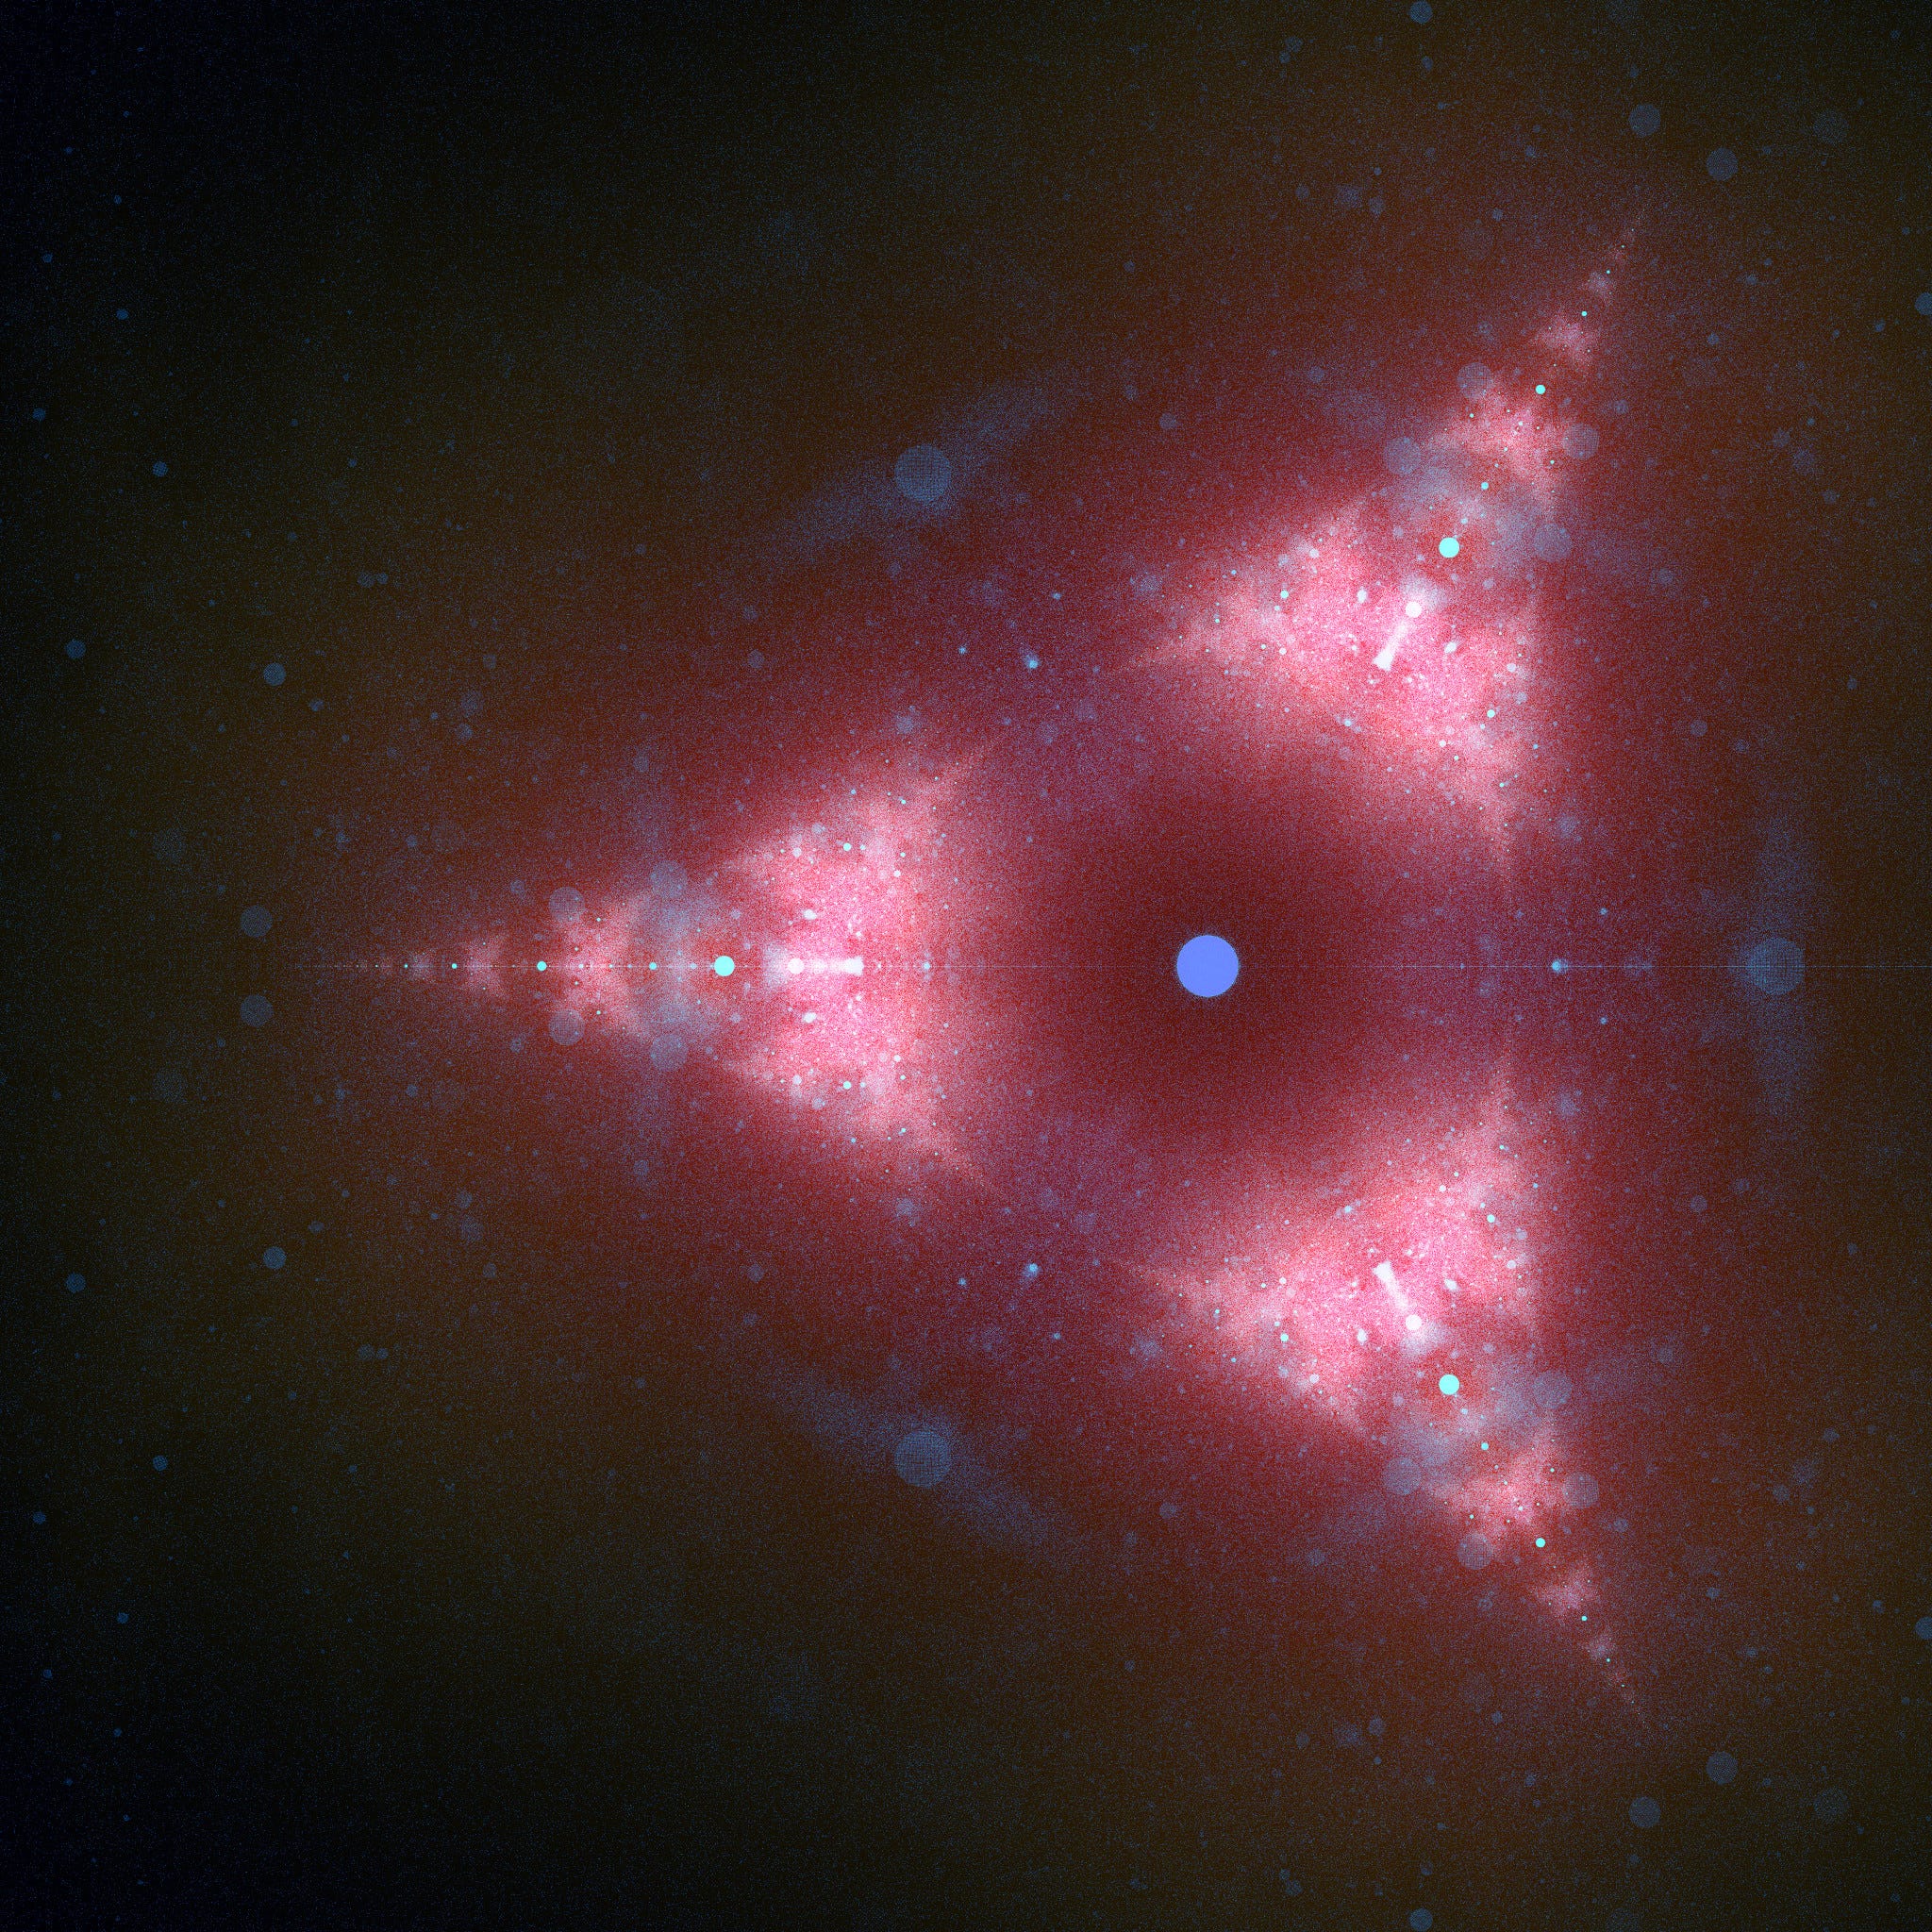
Actually there are two versions of this plot: including points inside the set and excluding them. The first is called “Anti Buddhabrot” and the latter is called “Buddhabrot”.
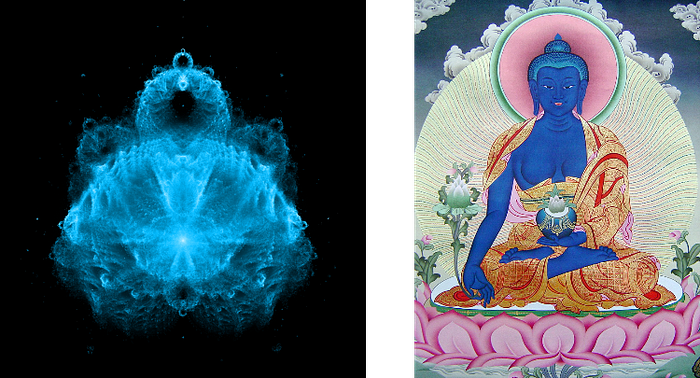
The name comes from the look of the plot: it you turn it by 90 degrees, it looks like a Buddha.

The first person to discover Buddhabrot was Melinda Green. And, well, it’s indeed fascinating view.
Here you can read the original text about the topic, and here you can read the wikipedia article.
As I described earlier, Buddhabrot values are calculated by tracing every point’s path during iterations. There are multiple ways to approach this problem. One of the most popular ones is “random drop”, when you take some random points and trace their paths.
I used more obvious approach: use calculated values while calculating the main plot. Since these paths are calculated anyway, why won’t we use this data to “fill” the Buddhabrot data?
There is another solution to this problem: it’s possible to get the desired image faster by only using points at the border of the set, and then iterate only points inside of this region. This optimization speeds things up significantly, but it’s good only if you don’t want to run calculations on everything else. Since I’m calculating the whole image anyway for every point for the usual plot, there’s no point in limiting points to this border region.
Besides, the main reason why Buddhabrot calculations take significantly more time is not the amount of calculations: it’s about the way I store the data about calculated points. Because of the need to constantly modify shared storage, the process slows down a lot , practically losing any benefit from parallelism.
It’s my fault, really, I should’ve set it up in a different way, but I didn’t put much thinking into it.
And there’s another problem to worry about: final image will inevitably be noisy. There are a couple of ways to reduce the noise:
- add more points for calculations (add additional “random drop”, add some more points from outside the image or, obviously, increase the resolution, calculating more points)
- make a very big image and downscale it (aside from introducing more points for calculations, it also “hides” the noise, which is what I chose to do)
- use noise cancellation algorithms (there are many of those, and I am too dumb to understand most of them to make my own implementation; some people I checked were using pre-existing software for that, like OptiX from NVIDIA)
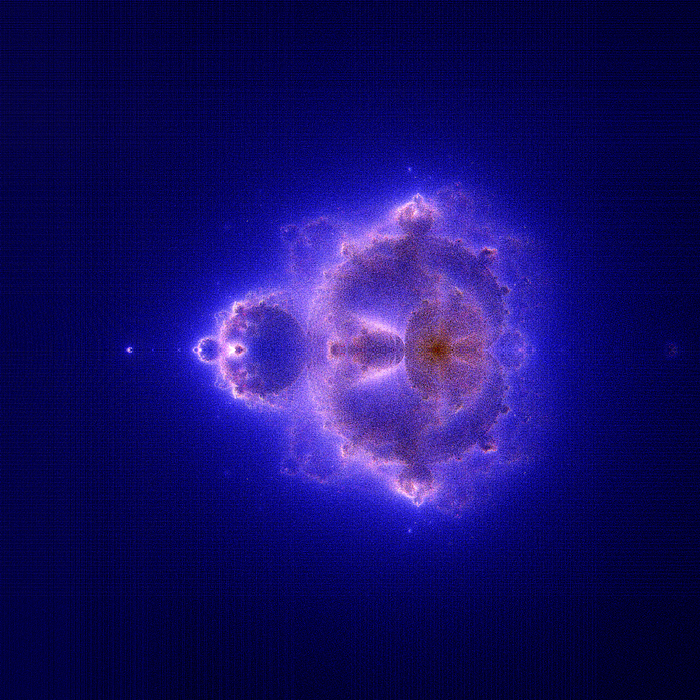
I’m using combination of the last two things. Buddhabrot images I have in this post are made with this approach.
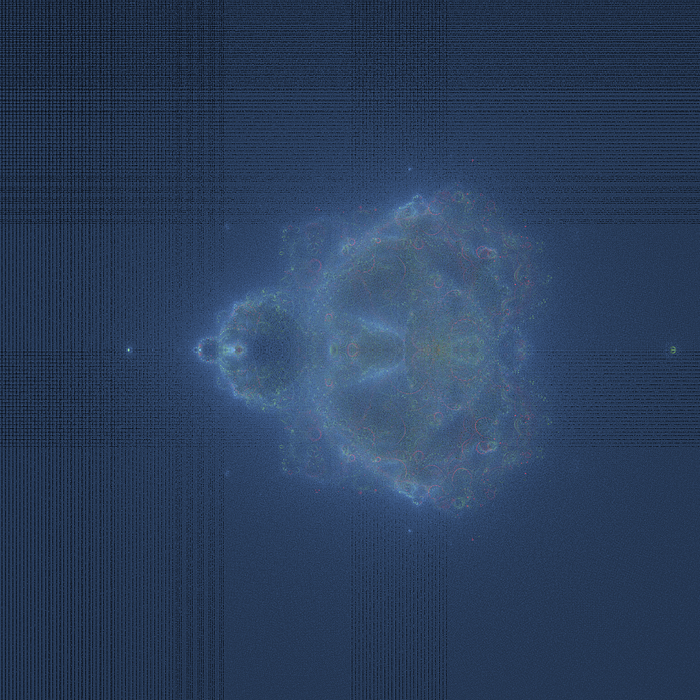
Ah, yeah, nebulas. The most interesting part is coloring the buddhabrots: how would you do that? It’s shades of gray by definition. And, well, there is already a small problem: different buddhabrots produced by different numbers of iterations have different brightness levels, which may make it hard to see the actual image. There are multiple ways to normalize the brightness, some more efficient, some less. I was using the 4th root of resulting fractions (number of passes on the point divided by the maximum number), which reduced the speed by which these numbers were becoming too dark. It’s not ideal, but it made it good enough.
But, again, it doesn’t solve all the problems, and you will need to adjust the levels on every color channel manually to get a good image. Oh, but what exactly are those nebulas?
Practically it’s the same view of the same plot. To get this you need three Buddhabrots with different numbers of iterations (ideally they should be multiples of the same base number, like 50, 500 and 5000 or 100, 1000 and 10000). Then you combine them using the plot with the least number of iterations for the blue channel, middle one for green and maximum for red (or whatever you see fit). Resulting image will already look cool enough, but for even better results you need to adjust levels for every color manually.
Fun fact: this is approach comes from space photography, where instead of number of iterations you have different exposure levels.


To get the best looking buddhabrots I used base number 50 and 32k by 32k pixels resolution, downscaled to 8k by 8k. Although, for some I used 16k by 16k.


There are more in the gallery below.
D language and other technical thingies
I always liked C programming language, but I didn’t really like the pointers shenanigans and all of this kind of stuff. When I first tried D a couple (and by that I mean 10) of years ago, I was fascinated by how easy and fun it was working with D. I tried some experiments with it, but there wasn’t really much I could do.
Since then the language changed a lot, got a much bigger and stronger functionality, and overall experience of writing in D feels like a weird mix of C, Python, Go and JavaScript at the same time (each for its own reasons), and what’s important, it feels comfortable to write with, it is easily understandable, and the language feels great on “lower levels”.
But with its unpopularity come some inconveniences. For example, some libraries are missing (nobody wrote them yet), some are broken (weren’t supported for a couple of years). Some libraries don’t have more or less usable documentation, for some things you may even need to look deeper into compiler’s docs. It doesn’t happen that often, and usually only makes things more interesting.
Technically all of this is true for any language, but with more popular ones you usually don’t even need to go “that deep”
And talking about the mandelbrot code, there were some interesting things I encountered and wanted to talk about.
Parallelism
It’s awesome. Literally ONE change in code in ONE line and everything is evenly shared between cores. Gorgeous.
There are some nuances. For example, if you’re relying on external data (“shared”) too much, there won’t be much profit from parallel calculations.
Live renderer (SFML)
It’s not actually my first “D lang experiment”, and previous ones were using SFML library to render graphics.
But, first, this library is C++ oriented and works in D through C bindings, and D module is made by enthusiasts (and is not really well documented).
Second, at some point I decided that rendering process takes some time (well, not rendering itself, but calculating all the values first), and speeding things up with GPU isn’t my way since I’m not experienced enough with shaders shenanigans, and I double it will do much in this case anyway. Besides, I want to render a disgustingly large image, and it will slow the rendering process down
Dlib
So instead I chose to render image and save it into a file. And my trusty partner was Dlib library by Gecko0307, a person from D language community and a game developer (who’s also making a D-based game engine).
https://github.com/gecko0307/dlib/
BMP format
As a side note. Initially I wanted to save everything as BMP, without any sort of compression. The problem I encountered was funny: if the number of pixels with a given resolution is too large, it won’t fit into BMP file header, making the image file practically unreadable.
Complex numbers
D language (like every other language, I suppose) has built in library to work with complex numbers (and the language even has special types for complex floats), but it would be way too easy, so I wrote my own implementation of complex numbers manipulations. And I didn’t really need much else.
I also have a commented piece that’s using std.complex library for complex numbers manipulations that I was using to check my own results.
High precision numbers
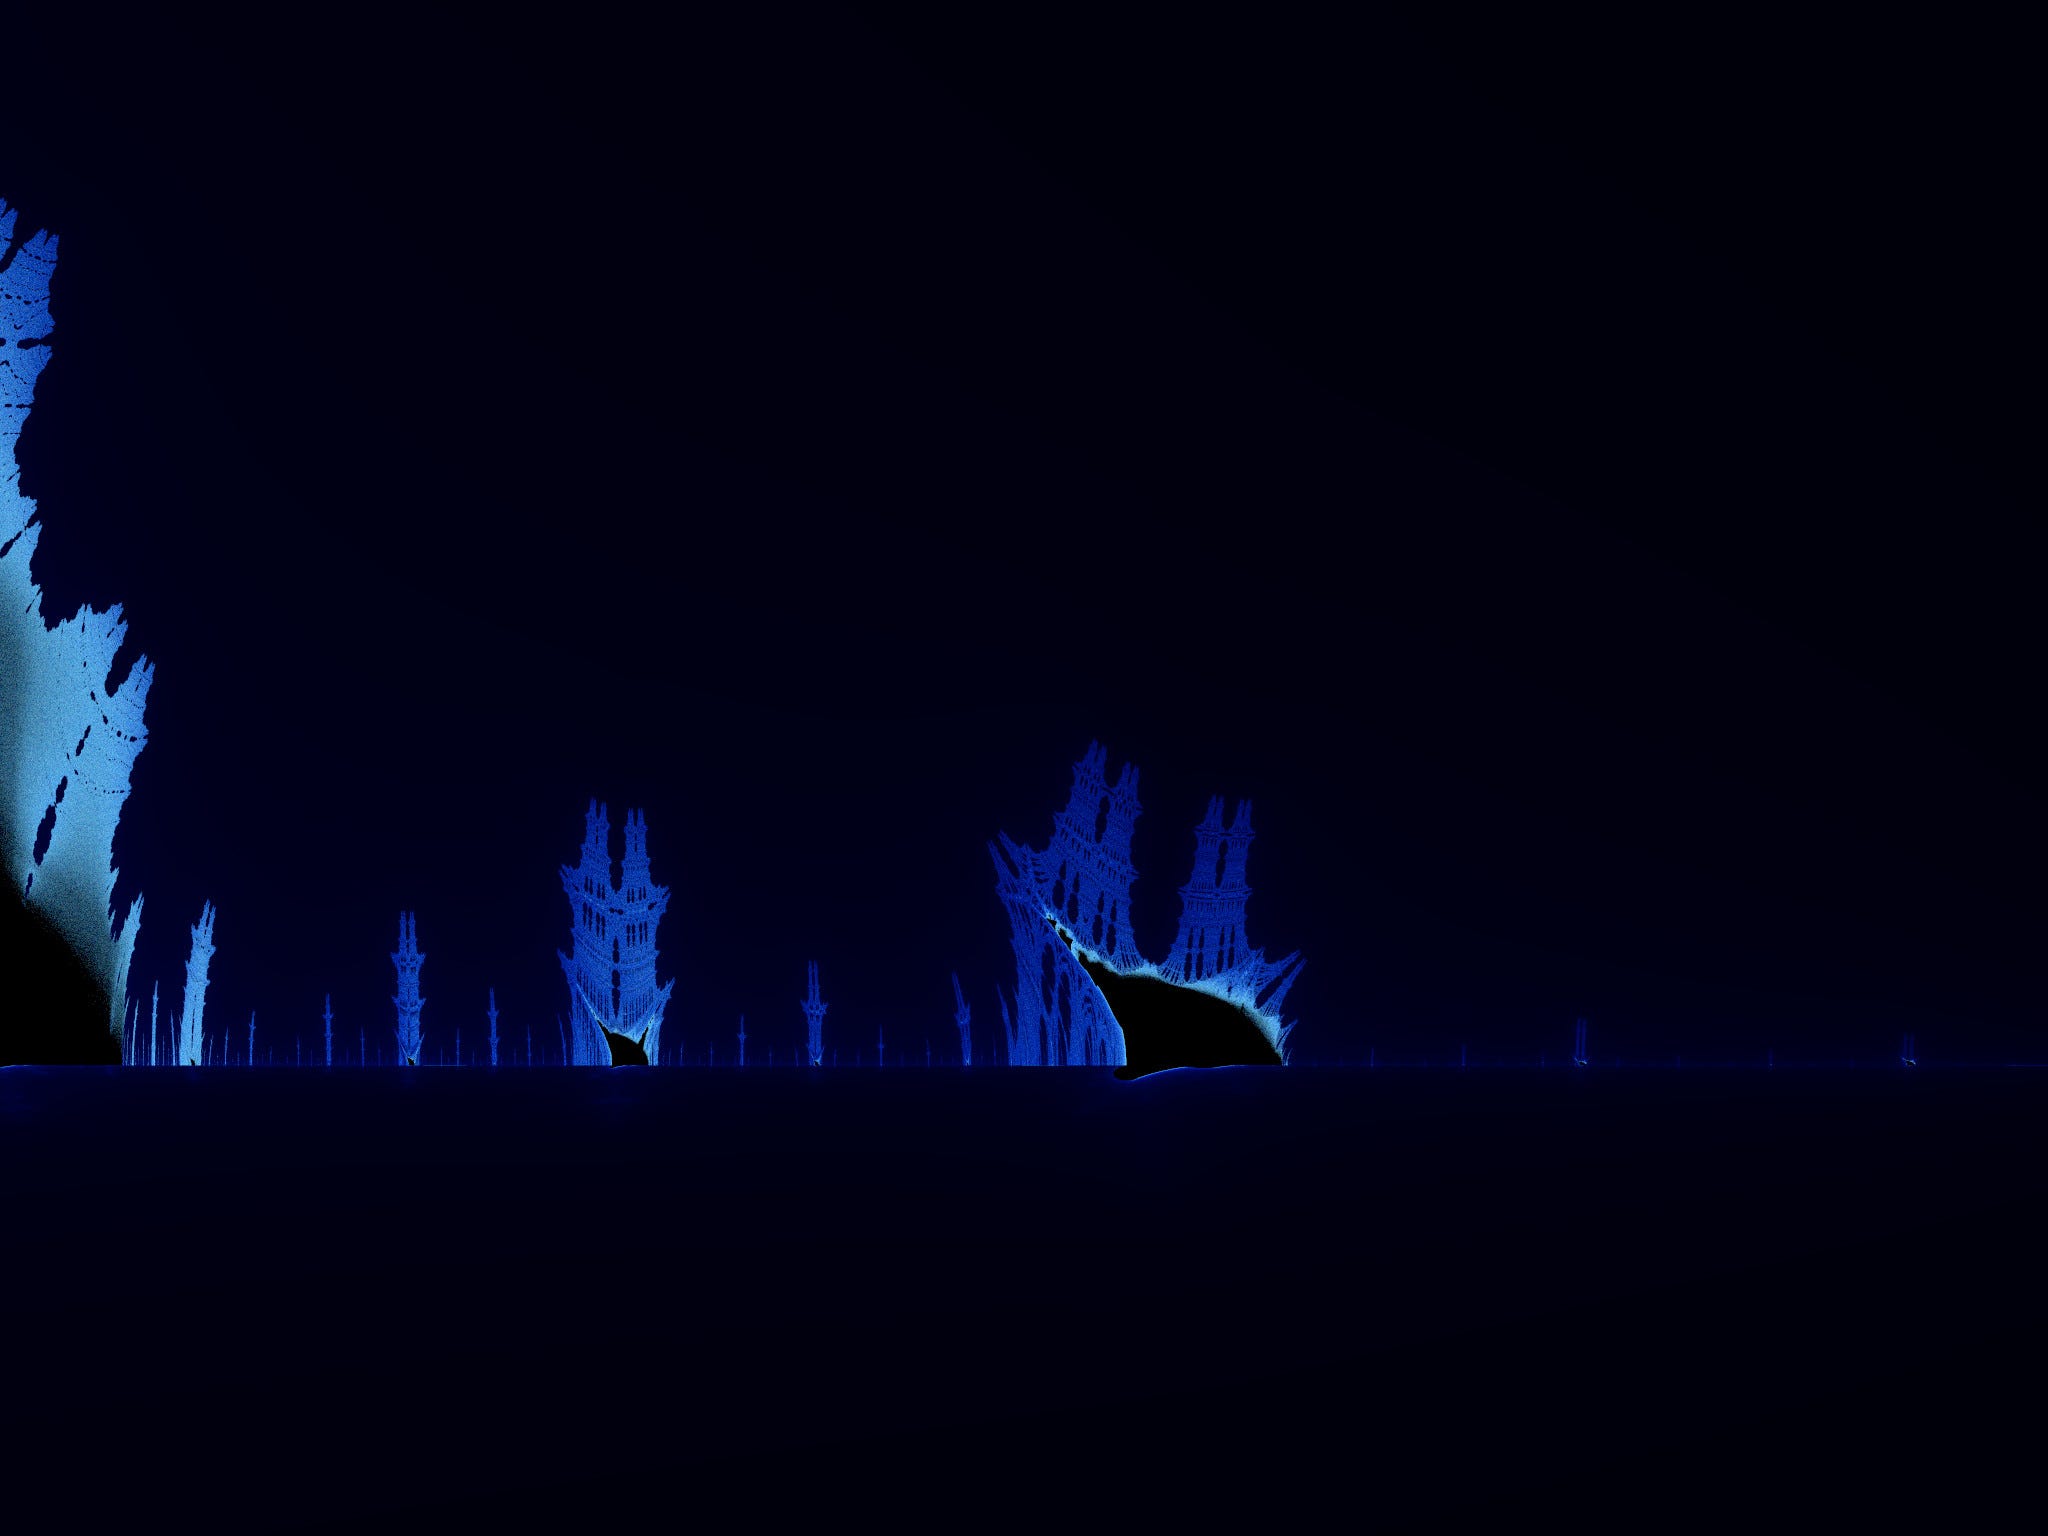
Generally speaking real variable type in D language is tied to CPU’s max supported floating point variable. And, of course, because of the way floating point variables work, there are some limitations after which you inevitably start losing accuracy and can’t get any deeper.
Indifferent implementations of mandelbrot set lurkers I found similar limits (it was usually around e-14, with a lot of numbers after the point). After this limit images either take incredibly long to calculate or start to look weird because of artifacts introduced by “rounding”.
It’s possible to solve this issue by using a “decimal” type, and I could even implement it myself, but
- calculations with decimals take MUCH MORE time
- I’m too lazy
- there are some existing D libraries with implemented decimal types, but they are either abandoned or not fully functional, and the only decent one just recently started moving to dlang-community group of repositories (and it doesn’t really work either for now)
So I decided to let this precision idea go, although I would like to make a hour long animation, going to e-1024 levels of zoom, like in this video by Maths town which inspired me.
Long calculations and serializations
At some point I realized that calculating massive Buddhabrots takes WAY TOO MUCH time, so I had an idea to store my progress somehow. But there’s no way to “make a custom handler” for SIGTERM/SIGKILL events, or any kind of application stop even really. So I started looking for another solution.
First, I needed a quick and “cheap” way to serialize data as binary. Initially I wanted to use some kind of msgpack implementation, but both I tested (obviously) weren’t really working well with what I had in mind. So I chose cerealed library for my purposes.
Overall it’s kind of clumsy implementation, but it worked for my needs. As a cli variable I pass the job work size, block is executed in parallel, as it should, and after this results are saved on disk, and then the next block is calculated. It prevents collisions and allows the program to have at least some sort of kickstart when restarting the calculation.
This approach slows things down by a lot, because saving it all to disk slows execution down, but at the same time for some VERY LONG tasks which you would like to stop for some time (to free resources and do something else) and continue later, this kind of losses are doable.
Animations and rendering in chunks
There’s nothing really to talk about. At some point I wanted to generate some cool animations, and I also wanted to make possible to generate images in “chunks”.
Base mechanisms behind splitting an image in chunks (or more accurately preparing zones and origin points for these chunks) or animations (aside from the fact that iterations, palette size and radius should scale using logarithms delta and exponent, linear scaling won’t do much here) are fairly easy.
Here’s what I found more interesting: for this idea to work elegantly and without any hickups, I slighltly rewrote my initial version of the renderer and made a queue of tasks for it. And this queue is filled with any image request: be it a simple set of parameters, animation frames or chunks of a bigger image.
Ah, yeah, while I was making queue think I also made support for JSON file as a source for tasks (you can describe anything in this kind of config, from coordinates and radius to fractal type and palette).
Observations, improvements to make and optimizations I found
So, I already pointed out, that nebulabrots require manual adjustments. I could probably combine color channels automatically and make a better channel normalization, but I was too lazy.
Fun fact: normalized brightness makes it hard to use chunks to combine buddhabrots because of diffferent levels of relative brightness in each chunk (so it requires manual adjustments).
Initially I made a funny mistake when rounding numbers while converting coordinates, which resulted in very funny artifacts (because I was too sleepy and wrote floor instead of round ).
To find interesting coordinates to draw, I was looking around the web. I found a lot of interesting points here: http://math.hws.edu/eck/js/mandelbrot/MB-info.html
Some of them I found manually though.
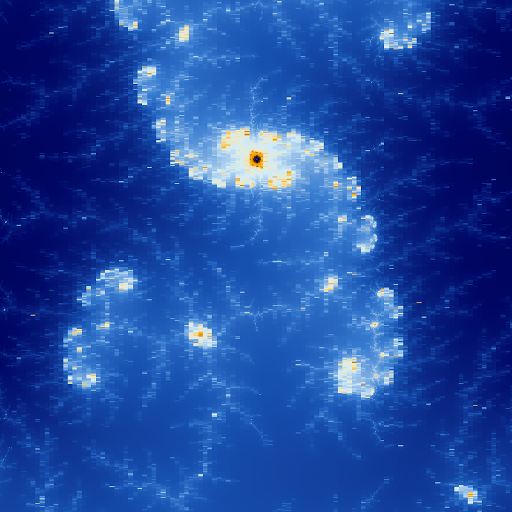
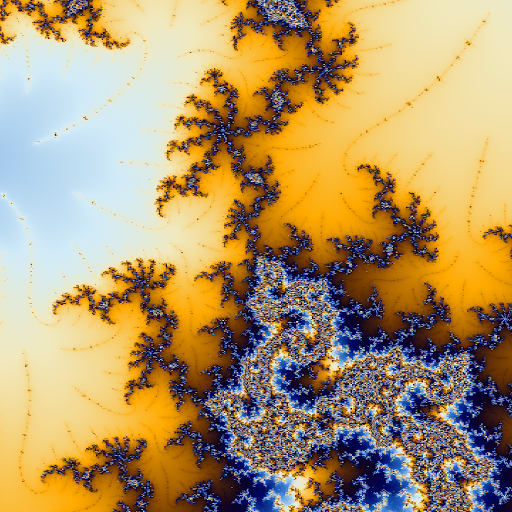
Precision fails on “deep dives” and I would like to fix it somehow to get to e-1024. Maybe sometime in future I will come back to this idea and make an upgrade.
There’s a way to fix it by using Decimal variable type, as I mentioned, using stantard IEEE-754–2008 as reference.
Generally speaking, any sort of crappy solution for this particular problem wouldn’t be too hard to make, BUT it would take some time, and I wouldn’t like to waste it on that. I found some pre-existing decimal libraries for D, but they weren’t working fully (like didn’t support division/multiplication) or were broken (because of lack of support). Some of them had descriptions with benchmarks that showed 20x slowdown.
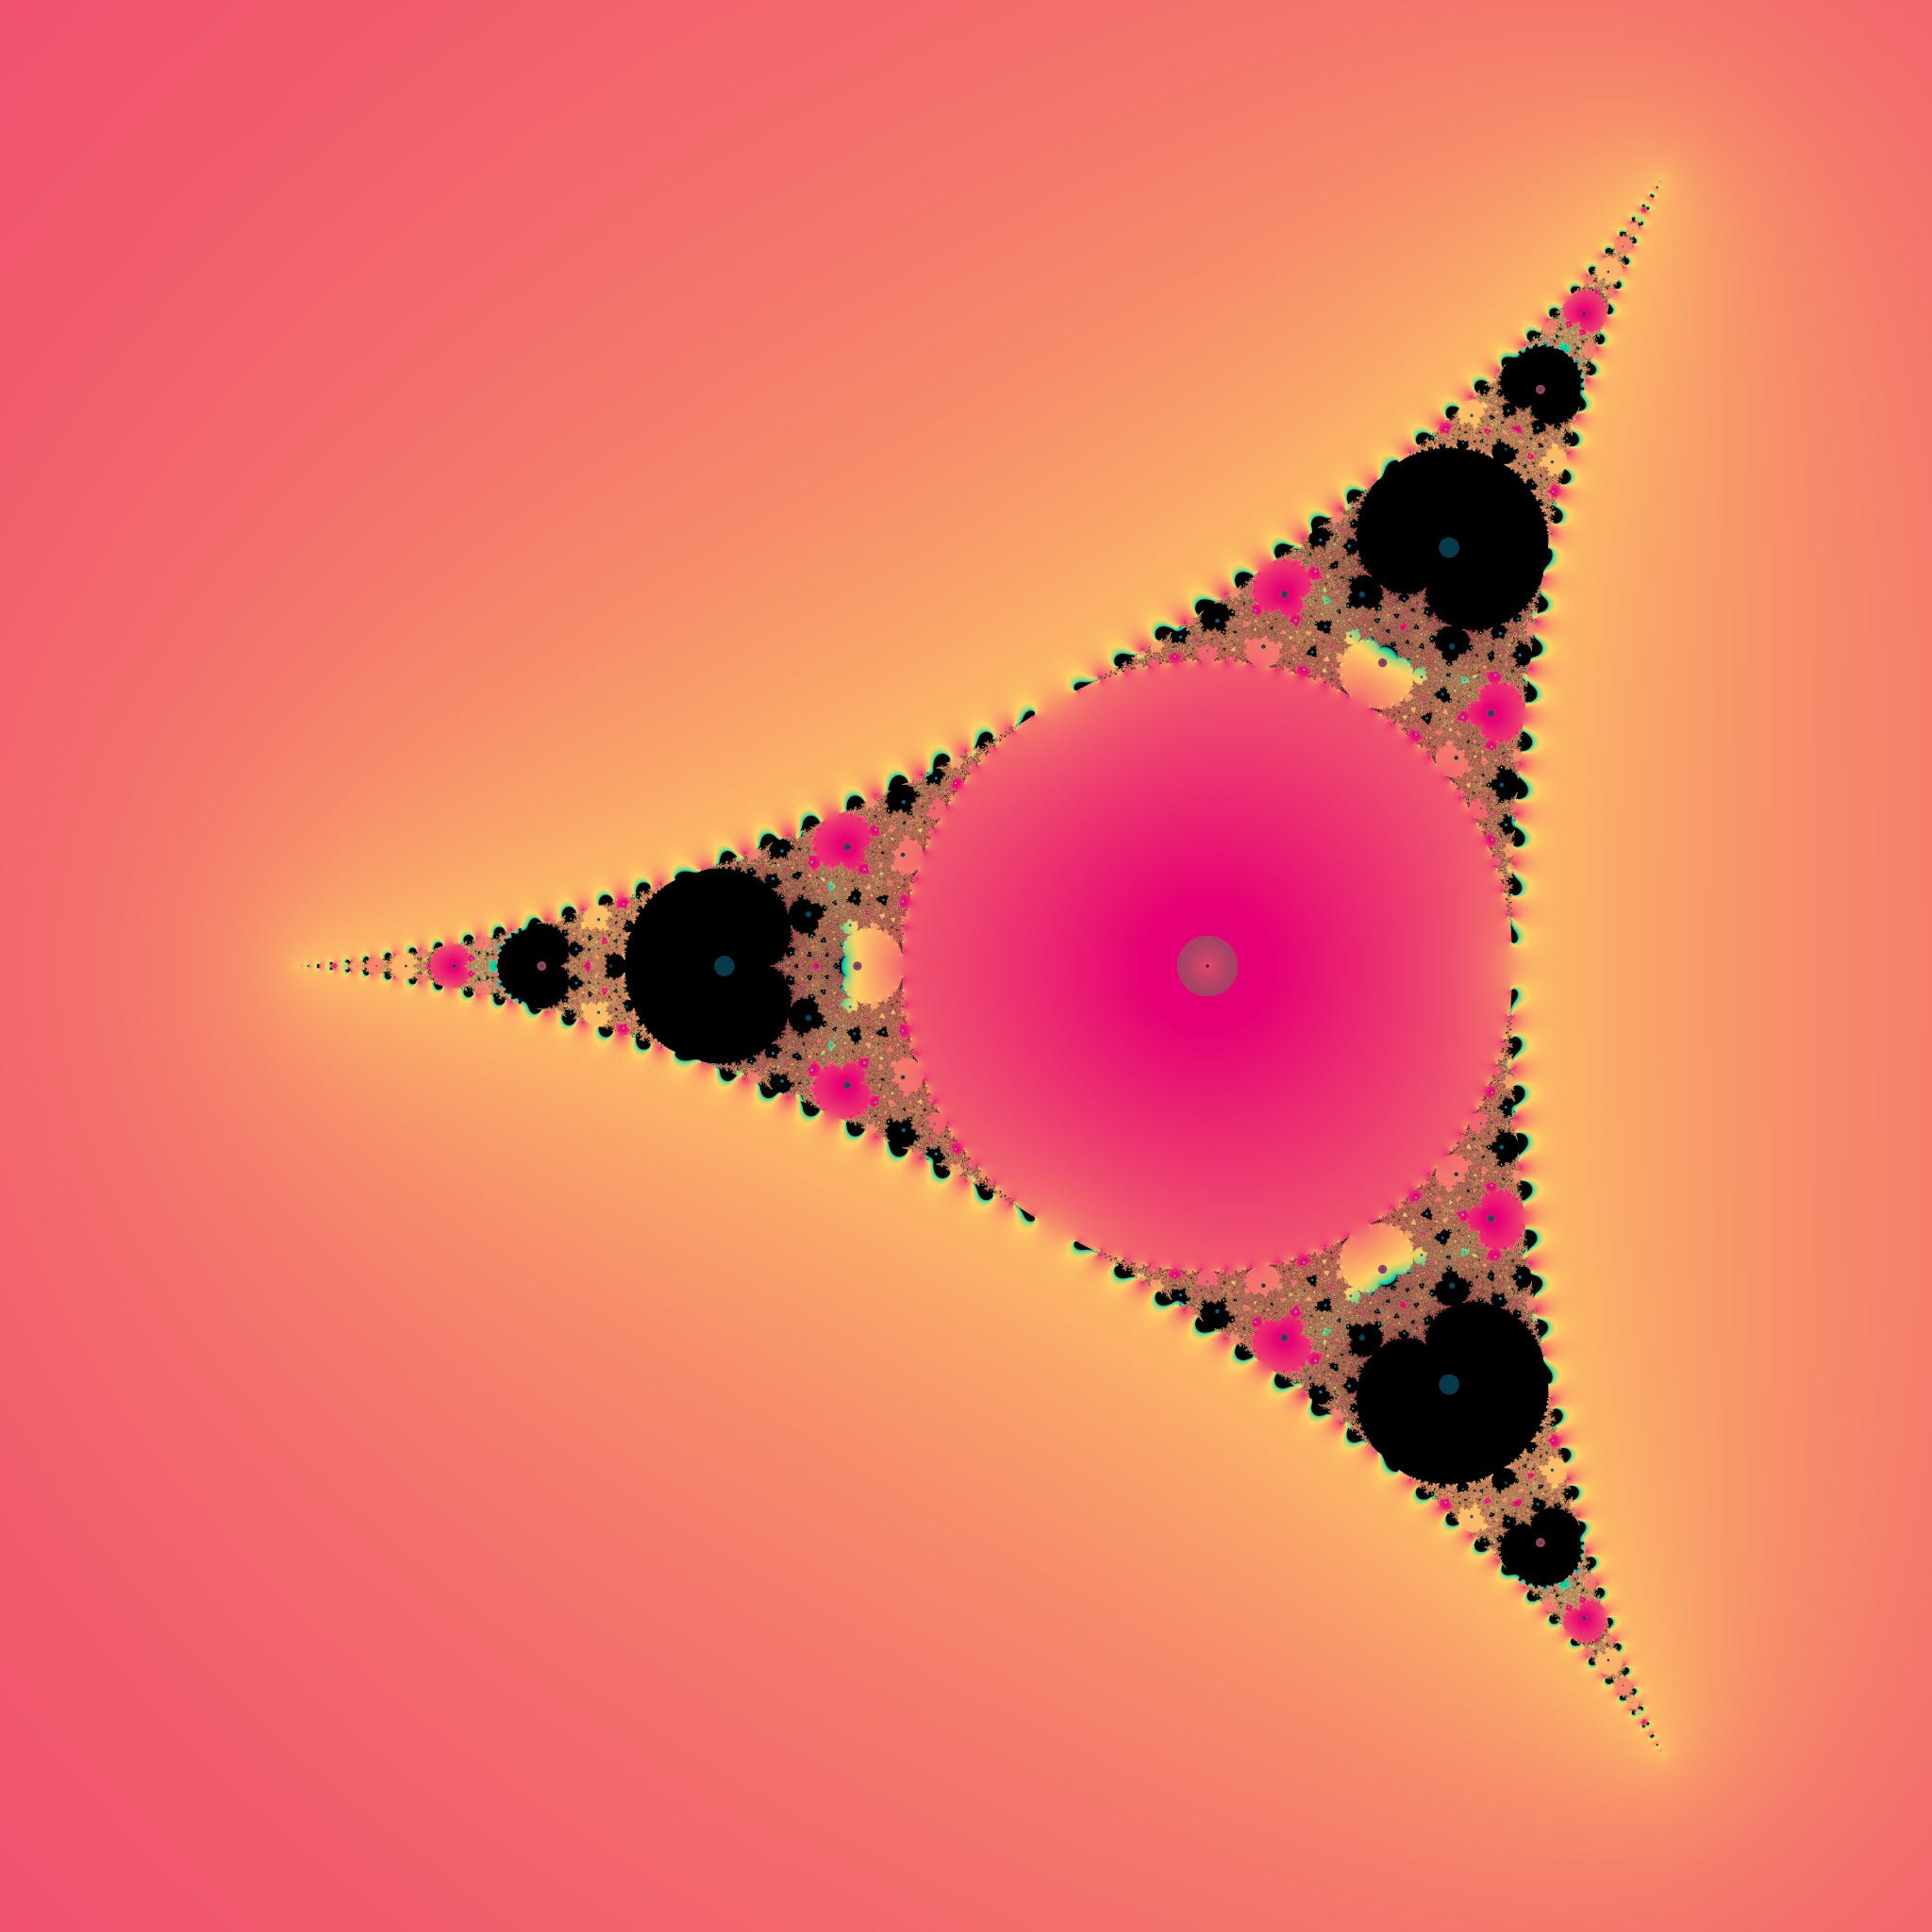
You can see these artifacts on the images to the left. Floating point numbers (classic programming implementations) are inherently inaccurate and at some point it will just get more obvious. Funnily enough, points in some zones are “better” for calculations (and don’t have artifacts), and most of the problems are happening on X axis (because there are more operations with different numbers happening on real path of the number).
Calculating required dwell number for a selected zone automatically is impossible. There are some approximations which quickly become useless, and there are methods which can calculate the maximum number of iterations based on points around the origin point to decide what dwell number is better. There are some other methods based on this idea, but I didn’t really like them, so I decided to let go og this idea.
When generating a video, as I described earlier, camera radiusm dwell number and palette size should be calculated using logarithms difference and exponent. Linear approach will be useless.
Calculating negative powers of complex numbers revealed to be a funny task. It’s fairly easy to calculate positive powers using trigonometric approach, but for negative powers you need to calculate positive power first and then “divide one by the result”, which practically means dividing both real and imaginary parts by modulo (Zr² + Zi²) of the resulting complex number.
Another funny thing: to actually make sense of negative power multibrots you need to “reverse” the number of iterations (substract resulting number of iterations from the dwell number).
I would also like to make an automatic search for Julia set values, but I was suddenly too lazy to do that. But you can find some useful information on the topic in this article, along with cool images:
https://nextjournal.com/lazarus/aggregating-values-to-the-mandelbrot-and-julia-sets
There are some other interesting articles about Mandelbrot set visualizations (and Buddhabrots), with information on various optimizations to speed up the process. The most interesting one would be this piece from David Aramant about how he calculated the 68.7 gigapixel buddhabrot:
https://davidaramant.github.io/post/the-buddhabrot-part-5/
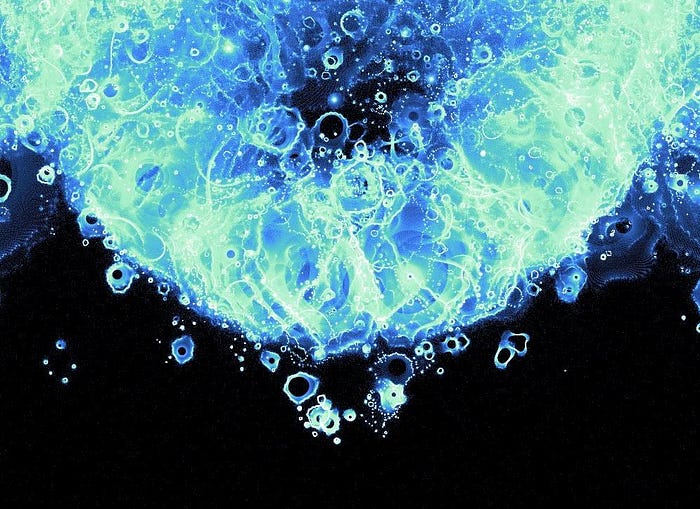
It also has general information about how to calculate it, as well as information about tone mapping to “normalize” the brightness and optimizations.
More about buddhabrots and optimizations: https://mathematica.stackexchange.com/questions/89458/how-to-make-a-nebulabrot
Pretty fast nebulabrots generator based on WebGL and shaders: https://github.com/donghaoren/buddhabrot-renderer (you can notice that image gets “better” over time, and with deeper dives calculation speeds drastically increase; but at least it’s possible to play around with some additional variables and rotations)
And this article suggests slightly different approach: using mutations and Metropolis Hastings algorithm: http://www.steckles.com/buddha/
Gallery
And of course the images! And even two videos!
I will leave some of the coolest looking ones here and the link to google drive at the end, where you can find the high resolution source images, source buddhabrots and other stuff. And if you’d like to reproduce my results, you may find all the values you need for it in file names.
(maybe one day my images will be on wikipedia too, hehe)

